Risk 3.0 Blog

  • GPS Disruption Risk

    This is the first in a series of articles examining potential future Systemic Dependency Risks.  In conjunction with case studies of past events, they are meant to sketch out the potential scope and magnitude of Systemic Dependency Risk events, and hopefully provoke thought about vulnerability to this scenario, as well as other potential Systemic Dependency Risk scenarios with similar characteristics.

    The universal, continuous availability of a GPS1 signal to provide a location’s relatively precise latitude and longitude is one of those modern miracles that we often take for granted.  A device with a GPS receiver can determine its coordinates if it can receive signals from at least four GPS satellites and a straightforward geometric calculation. 

    Complete global coverage is achieved with 24 orbiting satellites with 4 spaced evenly in each of 6 orbital planes approximately 20 thousand kilometers above the Earth.  The satellites were originally deployed from 1978 to 1991, and have been periodically replaced with improved equipment and augmented with additional satellites.  There are currently 31 operational satellites, of which 12 are second-generation design replacements launched between 1997 and 2009 (“Block IIR” and “Block IIRM”) that are all well beyond their original 10 year design life, 11 are second-generation design replacements launched between 2010 and 2016 (“Block IIF”) that are soon approaching the end of their original 12 or 15 year design lives, and 8 are third-generation design launched after 2018 (“Block III”) with 15 year design life.   There are an additional 2 third-generation design replacements ready for launch soon, with 12 more in production or on order for launches from 2028 to 2032.

    From science fiction to commonplace indispensable utility

    At first, GPS was primarily for military purposes, and civilian use was deliberately degraded by adding a time-varying pseudorandom error to the signal such that position was only accurate to within about 50 meters.  This “Selective Availability” feature was disabled in 2000. 

    The early devices were huge:

    PSN-8 Manpack GPS Receiver, made by Rockwell Collins in 1988-93 for military use.  It was about 16” x 16” x 5½”, weighed 17 pounds and cost $45,000.  
    Magellan 1000M GPS receiver, made by Magellan Systems Corporation in 1988 for civilian use (and military use when they ran out of Manpacks).  At 8¾” tall and 2” thick, it’s a little bit bigger than a standard brick.   

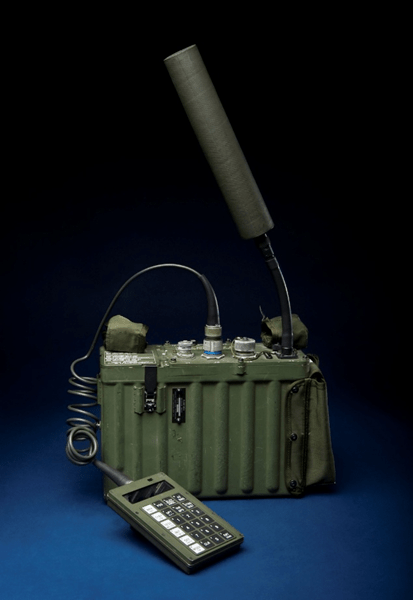
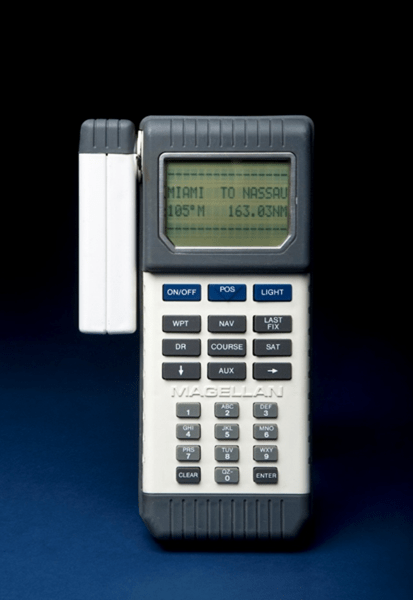
    Source:  National Museum of American History, Smithsonian Institution

    To be fair, these early devices included the antenna, processor, battery, input pad and display.  As technology improved, GPS receiver chips and antennae have become small – typically less than a couple of centimeters wide – and relatively cheap such that they can be included in many consumer and commercial devices that have their own power supplies and user interfaces.  

    Mobile phones began integrating GPS receivers in the early 2000s, most prominently with the iPhone 3G in 2008.  Availability of GPS coordinates in mobile phones fueled an array of location-based app services, in particular navigation and driving directions, as well as rideshare, delivery, mobile ordering, etc.  While these are now commonplace integrated with our daily lives, it’s important to remember that these capabilities and the business models that have grown around them are only around 20 years old.

    A less obvious use of GPS arises from the synchronized universal time stamp contained in its signal, which is used to measure distance in the GPS receiver’s calculation of location.  While individual devices and networks might have their own built-in clocks, these clocks will all develop slight differences over time.  Clocks can be resynchronized using the free timestamp contained in the GPS signal, or other applications may use the GPS timestamp directly. 

    Synchronized time across networks is critical to coordinating operations in electrical grids and telecommunications.  It’s particularly important for managing traffic and handoffs in cellular networks.  It’s also key for time-stamping transactions in the financial sector.


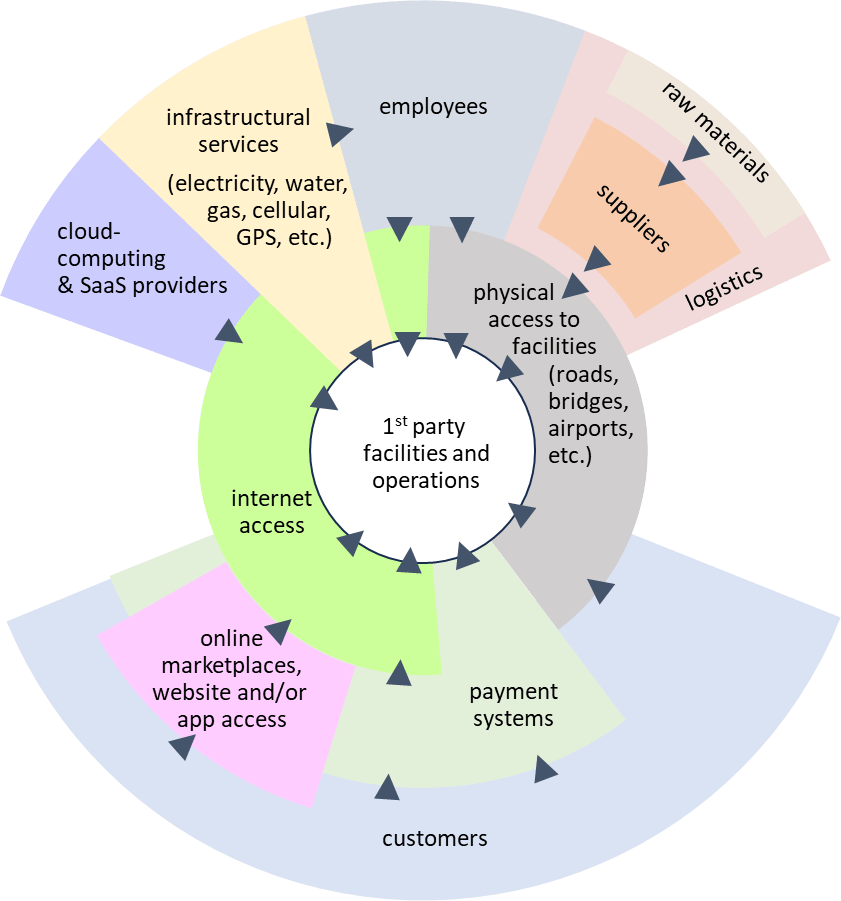
    As ubiquitous and fundamental as GPS availability has become, it does have some points of fragility in each of its key components:  the satellites generating the signals, transmission of the signal through the atmosphere (especially the ionosphere), the end-users’ receivers, and the ground-based control system that monitors the satellites and adjusts their orbits and clocks.

    We’ll first look at the potential impact of a GPS outage, and then outline some of the potential ways such an outage might occur.

    What would happen if GPS went down?

    Were GPS suddenly unavailable at a national or global scale for a protracted period, chaos would immediately erupt – perhaps similar to the CrowdStrike outage in terms of things unexpectedly not working and significant knock-on effects, but probably even more widespread. 

    Driving directions would be unavailable via mobile devices and many drivers would need to stop and make alternative navigation plans.  In this day and age, how many people know how to find a map and read it so as to figure out directions on their own?

    Airplanes in-flight at the time of the GPS outage may need to land immediately due to concerns about safe navigation and collision avoidance.  Further air traffic would likely be grounded initially and then put on constrained schedules to ensure safe navigation using manual and visual methods. 

    Some ships in tricky areas to navigate might run aground, and traffic at busy ports would grind to a halt with container ships switching to manual navigation, and the location of dockside containers suddenly no longer precisely known.  The situation might look somewhat like Maersk’s terminal shutdowns in the 2017 NotPetya cyberattack, but in every large modern port around the world rather than just 17 of the 86 operated by Maersk.

    Many consumer financial transactions would fail as a result of geolocation-based fraud algorithms that rely on geographic spend patterns and/or device co-location at the point of transaction.  Time stamps on financial markets transactions would soon become unreliable at the level of microseconds, which could trigger high-frequency trading algorithms to behave erratically and/or shut down, either of which could have an effect like the 2010 “Flash Crash2.

    But much like with the Y2K scare, it’s hard to comprehensively anticipate all of the devices and process which might have a GPS dependency.  Many dependencies will be discovered only when something stops working.

    The initial chaos would likely dissipate fairly quickly, as soon as workarounds and/or manual procedures were put in place of GPS-dependent processes.  However, some sectors do not have feasible workarounds, or would be so frictionally impaired by workarounds, that impacts would persist as long as the GPS outage lasted.

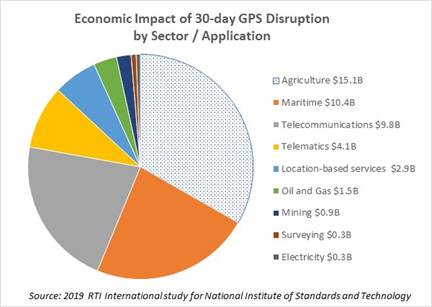
    A 2019 study commissioned by the National Institute of Standards and Technology (NIST) estimates that a 30-day disruption to GPS could have $15.1 billion economic impact on the agricultural sector were it to occur at a critical time during planting season3, and an additional $30.3 billion of economic impact across all other sectors.  Most of these economic impacts are indirect, frictional losses.  Outside of agriculture, the maritime sector has the largest estimated impact, primarily driven by delays in port operations.

    The NIST study’s economic impact estimate of $2.9 billion for location-based services in a 30-day GPS outage probably underestimates direct losses to businesses operating through mobile apps dependent on location-based services (which have in any case grown considerably since the 2019 date of the study).  The easiest of these to understand are ride-share and delivery businesses:  location and driving directions are at the core of their business model, and without GPS they would cease to function usefully.  The four large publicly-traded companies in this sector – Uber4, Lyft, DoorDash and Instacart – combined have nearly $70 billion revenues and $30 billion operating profit per year.  Adding in privately-held peers (e.g. GrubHub), self-driving taxis (e.g. Waymo, Zoox, Tesla), and shared scooters and bikes, the rideshare and delivery app sector is well over $200 million revenues per day and around $100 million operating profit per day.

    Beyond rideshare and delivery apps, there are other apps where location is not core to the business model but is still a necessary ingredient.  For example, online dating apps need to match users to other users in their area; Match and Bumble combined have about $4.5 billion revenues and $3.2 billion operating profit per year.  Online gambling apps are required to verify the user’s location for compliance with laws that vary from state to state; FanDuel and DraftKings combined have about $20 billion revenues and $9 billion operating profit per year, account for about three-quarters of the industry.  Comprehensively enumerating all of these location-dependent apps is quite challenging, but just between online dating and online gambling businesses, the tally is already over half the size of the rideshare and delivery app market. 

    A GPS outage would be very problematic for Pokemon Go. 

    Source: Niantic Inc.

    Additionally, location-based mobile advertising would not function without GPS on the device.  Apps that enjoy a higher likelihood of user acceptance of device location access – social media such as Instagram and TikTok, review apps like Yelp, weather apps such as The Weather Channel, etc. – could experience a loss of revenue as their advertisement inventory is sold into standard mobile ad campaigns rather than geo-targeted programs at higher prices.  By some estimates, location-based mobile advertising spend is around $40 billion annually – or $110 million per day – but there is no straightforward way to estimate how much of that is premium over standard mobile ads.

    Rideshare and delivery apps as well as location-based advertisers would be hard-pressed to find a workaround to not having GPS signals.  Other apps might be able to adapt to less precise methods (e.g. IP addresses, cell tower triangulation, etc.) but making those changes and deploying updated apps to users would not be quick.   

    At somewhere in the ballpark of $200 million per day direct profit impact to businesses dependent on mobile device location services, the NIST study’s estimated $2.9 billion overall economic impact for location-based services in a 30-day GPS outage seems very low.


    GPS Vulnerabilities

    From a dependent user perspective, it doesn’t really matter why a GPS outage has occurred, only how long it lasts; the business impact is the same regardless of the cause.  But it is worth considering some potential causes in order to roughly gauge both the likelihood and potential duration of a GPS outage.   Following are some potential GPS disruption scenarios:

    Geomagnetic storm

    Large solar flares erupting from the Sun can launch a burst of charged particles towards the Earth that interact with Earth’s magnetosphere.  On the one hand, this can result in a spectacular aurora visible at much lower latitudes than typical.   On the other hand, the fluctuations in magnetic field and charged particles in the ionosphere can wreak havoc with power and communications on Earth.  The noise in the ionosphere can distort and overwhelm the weak low-frequency GPS signal to the point where GPS receivers may read them inaccurately or may not be able to read them at all.  In a strong geomagnetic storm, these effects can last for days with regional or global scale.

    The GPS satellites are also vulnerable in a geomagnetic storm.  Charged particles hitting the satellites can cause unexpected behavior in circuitry, including altering solid-state memory containing parameters or instructions critical to satellite operation.  Low Earth Orbit satellites such as the GPS satellites may also experience drag, altering their orbits.  The GPS system relies on accurate data for the satellites’ positions in orbit.  Uncorrected orbits could lead to inaccurate GPS measurements, and eventually a risk of de-orbiting.  A geomagnetic storm may also affect power and communications for components of the ground-based “Control Segment” which synchronizes the GPS satellite clocks, updates their position information, and manages their orbit corrections.

    NASA’s Space Weather Prediction Center (SWPC) classifies geomagnetic storms on a 5-point scale, somewhat like hurricanes.  According to this scale, in a G5 geomagnetic storm, which SWPC rates at about 1-in-3 annual frequency (4 per 11-year cycle), “satellite navigation may be degraded for days”. 

    The March 1989 geomagnetic storm is the largest in modern record history, affecting power grids in North America (Quebec in particular) and interrupting control and communications with some satellites.  The GPS system was not yet fully operational or open to civilian use, so we have no report of whether or not there was any disruption.  It would have been a G5 on SWPC’s scale, and it had a peak Disturbance Storm-Time (Dst) index reading of -589 nanoteslas (nT)5.

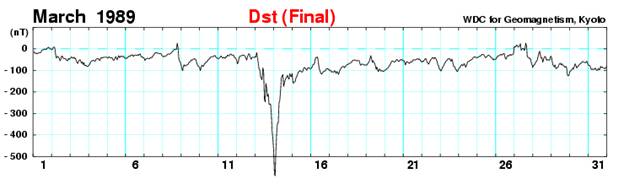
    The most recent G5 solar storm was the May 2024 “Gannon” storm6, which had a peak Dst reading of -412nT, not quite as severe as the 1989 event.   The storm degraded GPS accuracy for self-driving tractors in the US Midwest for at least 4 hours on May 10th, 2025 – peak planting season for corn in particular –  with lingering effects over the following two days.  One study estimated that this could have resulted in up to $1.7 billion economic losses due to delaying a portion of planting into a less productive period a couple of weeks later.   

    The 1859 Carrington Event obviously pre-dates both precise measurement and SWPC classification but is estimated to have had a Dst of -900nt, far more severe than either the 1989 or 2024 events – a “G6” on a scale of G1 to G5.   A Carrington-magnitude event would pose a potential threat to the GPS satellites themselves, which depending on the nature of impact and number of affected satellites could cause intermittent regional outages and accuracy degradation until satellites were corrected or replaced…  some mitigations might be possible over an intermediate horizon, but it might take years to fully correct.  Even if GPS satellites themselves were completely unaffected, it could result in multiple days of GPS signal disruption at a global scale. 

    NASA characterizes the Carrington Event as having about 1-in-500 year frequency, but it’s obviously somewhat uncertain given the relatively brief window of historical measurements, and estimates from academic studies are all over the place7

    Jamming and Spoofing

    Deliberate disruption of GPS signals has become a commonplace tool in recent conflicts.  Jamming refers to a noisy signal broadcast in the same frequency range as the GPS signal such that the GPS signal cannot be discerned by the receiver.  Spoofing provides false GPS signals that cause the receiver to calculate a GPS position different than the actual position. 

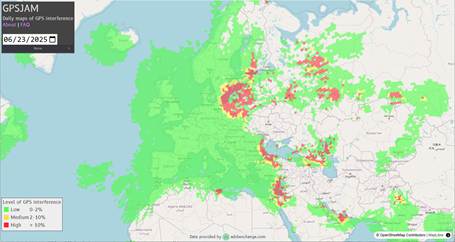
    Jamming and spoofing can have legitimate defensive purpose, such as spoofing by the Israel Defense Force along their northern border to thwart Hezbollah rocket attacks.  There is a wide zone of GPS disruption around Ukraine as both sides attempt to disrupt drone attacks.

    Source: GPSJAM.org8

    Jamming and spoofing have other nefarious uses by pirates, terrorists and potentially state actors engaged in non-combat provocation or sabotage.  There have also been instances of GPS jamming by commercial drivers attempting to circumvent their employer’s GPS-based fleet tracking systems.

    To date, GPS jamming and spoofing incidents have generally been too localized – at most regional in the vicinity of combat zones – to pose a significant Systemic Dependency Risk threat.  And the source of the attack can eventually be traced, so any widespread jamming or spoofing attack with meaningful economic impact would likely be eliminated fairly quickly.  That said, there is a hypothetical risk of jamming or spoofing from satellite-based sources which could be more challenging to eliminate.

    Satellite damage or malfunction

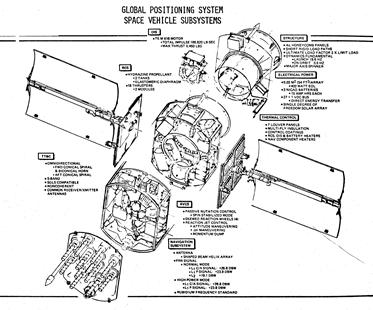
    Space is an unforgiving environment, with hazards ranging from space debris to radiation to temperature extremes.  Like most satellites, GPS satellites are made up of many components – solar panels, antennae, radio transmitters, atomic clocks, etc. — and the failure of any of those components could render a given GPS satellite unable to perform its essential functions. 

    Block I GPS Satellite component diagram

    The good news is that the GPS satellites are spread out in a Medium Earth Orbit almost 11 thousand miles above the Earth.  That puts them out of harm’s way from the much more crowded Low Earth Orbit where you might worry about a Kessler Syndrome cascade of collisions and/or space debris creating even more space debris and more collisions such that multiple satellites would be at risk.  While MEO is not without physical hazards – for example, a 2021 instance of a European GNSS Galileo satellite maneuvering to avoid collision with space junk – any such event in MEO would be unlikely to disable more than one GPS satellite, and we have several spares in orbit.

    The bad news is that the GPS satellites have many design features in common, particularly within each batch (or “block”) designed, built and launched under a given contract.  Unanticipated satellite design failures – for example, growing “tin whiskers” in space – can shorten the lifespan of whole classes of satellites with that design feature.  And unfortunately, those unanticipated design failures only emerge after the satellites have been deployed for some time.

    The challenge for the GPS satellites is that 12 of the 31 currently operational are from a single design class – “Block IIR” and “Block IIRM” – that have been in orbit between 16 and 28 years, against a design life of 10 years.  The good news is that these satellites are “well seasoned” in the sense that any serious flaws probably would have emerged already, and most military and civil satellites last well beyond their design life.  The bad news is that if any of these satellites’ components begin to experience high failure rates this far beyond design life, the entire batch of 12 may be subject to those high failure rates9.  And the further bad news is that it takes years to replace them:  the newest batch – “Block IIIF” – is not set to launch until 2027 at the earliest, at a rate of approximately 3 per year.

    In the event of a malfunction impacting multiple GPS satellites, the first few failures would be managed by spare capacity with 31 operational satellites plus 2 in-orbit spares vs. the required 24 satellites for fully operational GPS.  But if more than 9 are lost before replacement there would be an ongoing degradation involving lower accuracy and/or intermittency, potentially lasting for years.

    Software risk

    The GPS system’s “Control Segment” runs software algorithms that receive GPS satellite data from monitoring stations and produce instructions for the GPS satellites to synchronize their clocks, update their orbit data, and adjust their orbits when necessary.  Like any software, it is subject to the risks of both programming errors and user errors, as well as malicious attacks.  

    On January 26, 2016, a software bug pushed out in conjunction with decommissioning one of the GPS satellites caused a “UTC offset anomaly” on 15 of the GPS satellites that lasted for approximately 12 hours.  The time broadcast by the GPS satellites was only off by 13 microseconds, but that’s actually a huge problem both for location accuracy – approximately 4 kilometers given the location calculation’s sensitivity of approximately 0.3 meters per nanosecond – and synchronized timing applications.

    It’s worth noting that the existing Control Segment system went operational in 2007.  The “Next Generation Operational Control System” (OCX) project designed to replace the existing Control Segment system has run considerably behind schedule and over-budget relative to initial plans to deliver in conjunction with the launch of third-generation “Block III” GPS Satellites which began in 201810

    OCX was finally delivered in July 2025, and could go operational by the end of the year.  The good news is that it will include features to improve GPS accuracy and robustness as well as enhanced cybersecurity protection.  The bad news is that transition and early days of operation for system upgrades are often at higher risk for errors and malfunctions.

    Control Segment risks have the unhappy characteristic of potentially applying to many or all of the GPS satellites simultaneously, creating the potential for a disruption on a global scale. 

    The good news is that any errors are quite rapidly detected by GPS users, including sophisticated quality checks for sensitive time-based applications.   GPS satellites with bad signals can easily be marked “unhealthy” so that user applications can ignore them, at the cost of potential degradation of service if too many are unhealthy.  Errors in the nature of bad data sent by the Control Segment to the GPS satellites can be corrected.  The bad news would be any erroneous GPS satellite position instructions, which might take more time to correct or in the worst case be irreversible.

    Users’ GPS receivers may also be subject to systemic software issues, such as the “GPS Week Number Rollover” problem on April 6, 2019 requiring software or firmware patches for devices unable to accommodate the rollover event.

    …so, the GPS system clearly has multiple vectors of vulnerability.  For most of these vulnerabilities, the geographic scope and duration of disruption would likely be relatively local and brief.  However, with some lower but non-zero probability, each of these vulnerabilities is capable of regional or global scope, partial to full degradation of services, and prolonged duration in the range of days to years.


    You Are Here.  So now where do we go, and how do we get there?

    GPS disruption risk illustrates many of the key features of Systemic Dependency Risk in general.  It is a widely-shared dependency on a single point of failure with multiple vulnerabilities, and that dependency is a relatively new phenomenon as a result of the new-ish technology itself in combination with the business models that have grown around it.  Traditional insurance will not cover the risk of GPS disruption (other than a plane or ship accident), and the risk of accumulation across policies combined with lack of ratable history leaves it stuck squarely in the commercial insurance “protection gap”.

    So what are companies exposed to this risk to do?  The primary mitigation is to develop a “run book” so that workarounds can be put in place as swiftly and frictionlessly as possible.  This is obviously a requirement and generally already in place for applications where safety of lives is at risk, such as aviation.   Where commercial interests rather than lives are at stake, even a suboptimal workaround with higher costs or lower revenue generating capacity is better than complete outage and/or chaos.   Ideally, redundancy might be a better mitigation, but the scale of GPS systems is such that it likely out of reach for any individual company.

    The government is aware of the risk of GPS disruption and while some improvements are in progress or planned, they have been budget-constrained and/or not able to act with speed commensurate to urgency.  Similar to other public infrastructure risks, without any commercial forces to counteract insufficiently robust service, it’s easy for government to prioritize more politically salient spending with near-term tangible impact over long-term investments to reduce the risk of improbable events (unless and until the improbable happens, in which case there will surely be plenty of finger-pointing, and possibly also the political will to invest in solutions).  Because GPS is free, there is little incentive to create a private sector alternative.  This seems like an opportunity for private-public partnerships, particularly for local non-satellite navigation signals and clock synchronization.

    As with many Systemic Dependency Risks, a capital markets-backed insurance solution with a parametric trigger offers some potential future hope.  But even with such a solution, and more importantly in the absence of any insurance solution, companies need to “self-underwrite”:  identify where GPS disruption risk might affect their business, estimate the frequency and severity of potential GPS disruption scenarios, and assess the potential magnitude of losses in those scenarios in order to put a “cost of risk” against GPS disruption.  Recognizing the cost is the first step to prioritize doing something about it.  


    1. GNSS (Global Navigation Satellite System) is the generic term, while GPS (Global Positioning System) is the specific version created by the US government.  Europe’s Galileo is similar technology but more recently operational (2016).  There is also Russia’s GLONASS and some regional networks as well as non-satellite alternatives. ↩︎
    2. This whitepaper speculates that GPS signal spoofing could trigger such an event, citing research that has even suggested that the 2010 Flash Crash was triggered by time stamp errors. ↩︎
    3. For context, see below discussion of potentially up to $1.7 billion economic impact on corn farming due to GPS disruption from May 10, 2024 “Gannon” solar storm. ↩︎
    4. The risk factor section of Uber’s 10-K filing explicitly calls out third party dependencies including GPS.  Bird – prior to its 2023 bankruptcy and reconstitution as a private company – had a very blunt assessment of GPS dependency in its 2022 10-K risk factor disclosure:
      Our service relies on GPS and other Global Satellite Navigation Systems (“GNSS”).
      GPS is a satellite-based navigation and positioning system consisting of a constellation of orbiting satellites. The satellites and their ground control and monitoring stations are maintained and operated by the U.S. Department of Defense, which does not currently charge users for access to the satellite signals. These satellites and their ground support systems are complex electronic systems subject to electronic and mechanical failures and possible sabotage. The satellites were originally designed to have lives of 7.5 years and are subject to damage by the hostile space environment in which they operate. However, of the current deployment of satellites in place, some have been operating for more than 20 years.
      To repair damaged or malfunctioning satellites is currently not economically feasible. If a significant number of satellites were to become inoperable, there could be a substantial delay before they are replaced with new satellites. A reduction in the number of operating satellites may impair the current utility of the GPS system and the growth of current and additional market opportunities. GPS satellites and ground control segments are being modernized. GPS modernization software updates can cause problems with GPS functionality. We depend on public access to open technical specifications in advance of GPS updates.”
      ↩︎
    5. Dst measures changes in the Earth’s ring current.  It is calibrated to a normal value of zero, and large negative values indicate a strong solar storm. ↩︎
    6. Another Systemic Dependency Risk event in 2024! The “Harvey-Irma-Maria” year for Systemic Dependency Risk: Change Healthcare ransomware attack, Francis Scott Key Bridge collapse, CDK Global ransomware attack, and  CrowdStrike outage. ↩︎
    7. A widely-cited 2012 study estimated the frequency at 12% per decade, about 1-in-80 years.   However, a more recent 2019 study gives a 95% confidence interval from 0.46% to 1.88% per decade, or about 1-in-2000 to 1-in-500 years, while another recent 2020 study estimates 0.7% annual frequency, or about 1-in-150 years. ↩︎
    8. GPSJAM data are derived from aircraft GPS receivers registering “low accuracy”.  Blank areas have insufficient air traffic reporting, e.g. due to closed airspace. It’s likely that GPS signal jamming has been widespread throughout the blank area in and around Ukraine. ↩︎
    9. It’s also worth noting that the 11 operational GPS satellites in “Block IIF” launched between 2010 and 2016 are near or beyond their 12 year design life; one of the original 12 “Block IIF” satellites experienced a clock failure 2 years into its life and is non-operational. ↩︎
    10. The legacy Control Segment was upgraded and an initial phase – “Block 0” – of OCX in 2017 to accommodate launch and control of “Block III” satellites as well as a subset of their new capabilities. ↩︎
  • Change Healthcare and CDK Global ransomware outages

    Prior to the CrowdStrike outage, 2024 was already well on its way to becoming the HarveyIrmaMaria year1 of Systemic Dependency Risk with the Change Healthcare ransomware attack in February and CDK Global ransomware attack in June, as well as the Francis Scott Key Bridge collapse and resulting Port of Baltimore closure in May.  While Change Healthcare and CDK Global impacted very different industries – healthcare services and automotive dealerships, respectively – they have in common some very important features for understanding Systemic Dependency Risk, and will together be the subject of this latest installment of our ongoing series of case studies. 

    Change Healthcare

    UnitedHealth’s Change Healthcare subsidiary grew from a healthcare technology startup (or startups)2 into a giant in the healthcare “Revenue Cycle Management” (RCM) space over the first two decades of the millennium.  Somewhat uniquely to healthcare, RCM is the set of tools and processes that facilitate healthcare providers and hospitals getting paid for the services they provide to patients.  Apologies in advance for descending into the weeds on this, but it’s necessary in order to understand how Change Healthcare became such a critical dependency in an industry that represents 17.6% of US GDP.

    There are two reasons that RCM is so significant for the healthcare industry:

    1. The bulk of payments for healthcare services come via third parties (health insurers and government plans), rather than directly from their customers (patients)3.
    2. The coding of claims for healthcare services reimbursement is byzantine4.  Inaccurate or incomplete coding can result in claims being rejected by payers.

    RCM includes many different services, including “eligibility and benefits” checking to ensure that a patient’s healthcare plan info is valid and to determine copayments and deductibles, “claims editing” to correct coding that might result in rejection, remittance tracking and posting, etc.  The whole multi-step, multi-party healthcare payment system has the unnecessary complexity of a Rube Goldberg machine and is only slightly less comically surreal. RCM tools and services don’t so much aim to solve the problem as to optimize revenue yield and efficiency within the system.

    At the heart of most of these RCM services are Electronic Data Interchange (EDI) transactions transmitted from providers to payers and vice versa.  Transitioning healthcare claims from paper via mail or fax to EDI transactions in the 1990s and early 2000s was an obvious win for RCM technology, saving labor, paper and postage costs.  It also dramatically reduced the time between rendering healthcare services and receiving payment, liberating a lot of tied-up working capital in the healthcare system.

    Because of the complexity for each provider arranging electronic connections to each payer with their specific format and coding requirements, RCM has grown around an obscure utility in the healthcare industry: EDI clearinghouses. The US Department of Justice in their objection to UnitedHealth’s acquisition of Change Healthcare (more on this in a moment) provided the diagram below to emphasize the criticality of EDI clearinghouses in the healthcare RCM transaction flow:

    Each provider connects to an EDI clearinghouse which routes the EDI transaction to the payers.  In fact, many payers also arrange with an EDI clearinghouse to manage their inbound transactions, such that a transaction might go from a provider to their EDI clearinghouse and then to the payer’s EDI clearinghouse en route to the payer.  Where there are many providers and many payers, there is an obvious efficiency to this intermediated network arrangement in terms of reducing the number of pairwise connections, and this favors consolidation and scale for EDI clearinghouses:   

    This tendency of networked technology solutions to evolve into critical dependency nodes will be a recurring theme for Systemic Dependency Risk across many different industries and business processes.

    Change Healthcare has by far the biggest EDI in the industry, claiming in 2020 to process over 15 billion transactions and $1.5 trillion of claims annually… that’s over 30% of annual US healthcare spending and over 40% of the estimated industry total of 34.5 trillion electronic transactions in 2020.    The US Department of Justice merger objection noted that more than half of all commercial payer medical claims went through Change Healthcare.   When the government is alleging anti-competitive threats due to excessive market concentration and vertical integration with underlying industry-wide technology infrastructure, that should be a strong clue about potential Systemic Dependency Risk.

    So, it was huge news when Change Healthcare experienced a ransomware attack on February 21, 2024.  For most of the public, the headline was the size and scope of the data breach:  personal identifiers and health information for over 100 million individuals (subsequently revised upwards to 190 million).  But it was also extremely disruptive to the US healthcare system when Change Healthcare shut down its services in response to the hack.  Healthcare providers who used Change Healthcare’s clearinghouse began “hemorrhaging money” as they were no longer able to process claims and receive revenue for the services they provided.  Many experienced disruption even if they used a different clearinghouse because some transactions were submitted to payers that used Change Healthcare for inbound transactions.  Major health insurers other than UnitedHealth saw 15-20% reductions in submitted claims volumes, though that was presumably to their benefit (other than a headache for their actuaries doing reserving analyses).

    In addition to not being able to process claims, healthcare providers were unable to perform Eligibility & Benefits and Prior Authorization checks to determine the patient’s insurance coverage and any copayments or deductibles prior to providing services.  Without this step, providers may have failed to collect amounts owed by patients and/or been unable to schedule non-urgent services which created real losses, as opposed to the cash flow timing problem from inability to process claims (assuming claims would eventually be processed once systems were restored).

    The full magnitude of healthcare industry cash flow disruption is difficult to estimate, but the scale was enormous.  The Massachusetts Health & Hospital Association reported losses of over $24 million revenue per day from a survey of just 12 of its member hospitals.  The American Hospital Association surveyed nearly 1000 of its member hospitals and reported that around one-third had impact of more than half their revenue, and around half had revenue impact of $1 million per day or greater.  Some back-of-the-envelope math: with aggregate annual hospital revenues of approximately $1.5 trillion, that’s $4.1 billion revenues per day, and if around 30% went through Change Healthcare’s clearinghouse, that’s a $1.2 billion per day cash flow problem.    

    Most hospitals and health systems maintain substantial cash balances as a buffer to short-term disruptions.  A 2022 study of non-profit hospitals with S&P credit ratings found an average of 218 days cash on hand, with only 9% rated below “adequate” with less than 110 days cash on hand (or 100 days for multi-hospital health systems).  Three large publicly-traded healthcare systems reported only “transitory” disruptions.  Some health systems were able to switch clearinghouse vendors, with Change Healthcare’s biggest competitor Availity quickly stepping in to offer free “lifeline” service.

    Physician practices were far more vulnerable due to less robust cash reserves and/or credit facilities, and less agility in switching clearinghouses or engaging in other workarounds.  The American Medical Association conducted physician surveys in late March and late April of 2024 which reported dire consequences:  widespread loss of revenues and additional staff expenses, missing payrolls, dipping into personal funds to cover practice expenses, and a number of anecdotes worrying of impending bankruptcy. More back-of-the-envelope math:  $978 billion of aggregate annual revenue for physician and clinical services is $2.7 billion per day, of which around 30% impacted by Change Healthcare’s outage works out to about an $800 million per day cash flow problem.   

    UnitedHealth quickly set up a “Temporary Funding Assistance Program” on March 1, 2024 to provide interest-free loans to practices whose cash flows were disrupted in hopes of alleviating some of the liquidity issues.  These loans quickly ballooned to $3.9 billion as of March 31, 2024 and $6.5 billion as of April 30, 2024, and continued to rise to $8.1 billion as of June 30, 2024 and ultimately $8.9 billion gross and $5.7 billion net of repayments as of September 30, 2024… repayments have continued slowly5.  

    UnitedHealth hoped to bring the clearinghouse functions back online by the middle of March 2024, three weeks after the attack.   This proved to be overly optimistic, particularly re-establishing connections with payers.  Many of Change Healthcare’s core services were nearly back to normal by April 22, 2024 – two months after the attack– but it wasn’t until November 19, 2024 – almost nine months after the attack – that all services were fully restored.

    While the cash flow impacts were potentially catastrophic – probably many tens of billions of dollars for the industry – they were transitory and partially mitigated by UnitedHealth’s interest-free loan program6 and switching to other clearinghouses.  It’s far more challenging to estimate the non-transitory real costs: paying staff overtime to manually submit via paper or fax, cost to setup alternative clearinghouse arrangements, uncollected copayments, procedures not performed and/or claims denied for lack of Prior Authorization, etc.  One way to put an order of magnitude on it is to look at the savings achieved by the healthcare industry’s adoption of electronic transmission.  The Council for Affordable Quality Healthcare estimates that the average cost of manual transactions is more than double that of electronic transactions, generating $160 billion of annual cost savings for providers and payers at current industry adoption rates.  To put a rough upper bound on the cost, we can suppose that extra costs and frictions during the Change Healthcare outage were similar to the cost savings from avoiding manual transactions for the fraction of transaction volume impacted by the outage, around 40%:  that works out to around $5 billion to $10 billion for the outage lasting several weeks to two months.

    Incident Summary
    Change Healthcare Ransomware Attack – February 21, 2024

    Source of disruptionTransaction Interchange
    Root causeRansomware
    Scope of impactGeographicUS
    IndustriesHealthcare
    Estimated revenue$5 billion per day7
    Duration1 -2 months
    Estimated lossesEconomic$5 – 10 billion
    InsuredNone (?)
    Known lossesNone

    CDK Global

    CDK Global is the dominant player in Dealer Management Systems (DMS)8, which is a mission-critical technology suite that includes accounting, payroll, vehicle inventory, customer relationship management, financing and insurance, service scheduling and parts inventory, website / digital marketing, and in some cases full IT outsourcing as a Managed Service Provider9.  In parallel but in contrast to the straightforward physical flow of cars from manufacturer to dealership to customer, the DMS handles an intricate collection of electronic transactions that enable car sales in the context of the modern business model of an auto dealership.

    While the scope of DMS is much broader than Revenue Cycle Management in healthcare, there are some key similarities in the networked intermediation between auto manufactures and dealers, as well as between dealers and the auto finance ecosystem (credit bureaus, banks, and insurers)… and ultimately the greatest resemblance of all:  without their DMS, car dealers would have to revert to the manual processes of the previous century. 

    When CDK Global had to shut down due to a ransomware attack on June 19, 2024, it threw auto dealerships across the country into chaos.   Manual processes for new sales were inefficient and slower.  Information on in-process deals was inaccessible, so the sale was either delayed or lost.  Basic administrative functions like payroll were impacted.  

    The impact of not being able to sell cars is a bit tricky: if the customer’s purchase is merely delayed, the impact to the dealer might only be the additional interest expense on floorplan loans financing their vehicle inventory; however, if the customer goes to a different dealer, the sale is lost permanently.  In either case, the dealer continues to incur the cost of operating their business – real estate expense, staff expense, etc. – during the delay. 

    It’s particularly worth noting that auto dealerships have evolved a business model where the two most important operations are (1) repair and maintenance services and (2) dealer incentives on financing and insurance10.   Financing and Insurance is obviously mutually interdependent with sales, but far more difficult to revert to manual processes when it comes to things like credit checks, lender offers, loan and lease payment calculations, etc.  Parts and service is not immediately dependent on sales, but also has significant systems dependence for scheduling, parts inventory, customer account management and payments.

    CDK Global’s core DMS services began to be restored for some large customers in the second week following the incident11, with full restoration in week three12.  However, even with CDK Global’s systems fully operational, the full capability of the network continued to recover slowly as auto manufactures and other third parties in the ecosystem reconnected13

    One expert estimated the economic impact at $1.02 billion, including lost earnings on car sales, additional interest expense on floor plan loans, lost earnings on parts & service, and additional staffing and IT costs.  All six of the large publicly-traded dealership groups – collectively representing almost 10% of the industry’s new car unit sales volume – reported that their sales volumes were negatively impacted by unavailability of their CDK Global DMS, three of which providing quantitative estimates of the overall impact:

     Estimated Impact% of Annual RevenuesAdditional Notes
    Asbury Automotive Group$19 million to $23 million
    ($0.95 to $1.15 per share)
    0.12%Cyber insurance limit of $15 million after $2.5 million deductible…  no info as to whether this claim was successful.
    Sonic Automotive$47.2 million0.41%Includes $13.4 million additional expense for commission-based staff
    AutoNation$71 million
    ($1.75 per share)
    0.34%Includes $43 million additional expense for commission-based staff

    Also note:  Group1 Automotive reported $5.9M one-time expense for sales staff compensation, and also noted that they had recognized a $10M recoverable for business interruption insurance(!)

    The above three dealership groups collectively represent 4.2% of the industry’s annual unit sales volume… extrapolating their $140 million aggregate loss to the entire industry, assuming CDK Global has 40-50% of the DMS market share, gives an estimate of $1.3 billion to $1.7 billion losses. 

    Incident Summary
    CDK Global Ransomware Attack – June 19, 2024

    Source of disruptionSoftware-As-A-Service /
    Managed Service Provider /
    Transaction Interchange
    Root causeRansomware
    Scope of impactGeographicPrimarily US
    IndustriesAuto dealers, and to a lesser extent upstream (auto manufacturers) and downstream (online marketplaces, auto lenders)
    Estimated revenue$1.3 billion per day14
    Duration2 – 3 weeks
    Estimated lossesEconomic$1.0 – $1.7 billion
    Insured≪$100 million
    Known losses• AutoNation:  $71 million
    • Sonic Automotive: $47 million
    • Asbury Automotive Group:   $19 – $23 million
    • Group1 Automotive:  at least $10 million
    TOTAL:  at least $150M

    Lessons learned

    1. Systemic Dependency Risks can come from unexpected places

    As with the CrowdStrike incident in the previous case study, one of the biggest lessons is to look beyond the traditional supply chain for dependency risk.  Both Change Healthcare and CDK Global were fairly obscure to the general public, but should have been well known in their respective industries.  They likely would have shown up on vendor lists, and featured heavily in IT integrations and approvals.  Yet they might not have been on the radar for supply chain risk because they’re not suppliers in the traditional sense of goods and services.  And there’s also an issue of focus on the bigger, more important issues:  medical care operations have a high-reliability requirement, and RCM isn’t strictly required to provide care.  Car sales tend to focus on the heavy, expensive tangible objects physically present on the dealer’s lot.   To find these more subtle dependencies outside of the “core” product/service delivery chain, you almost have to trace in reverse from the revenue.  Dependency risk – or supply chain in the broadest sense – includes *all* the inputs required for your product or service to produce revenue.

    2. Value of diversity in commercial ecosystems

    Another repeat from the CrowdStrike case study:  it is simply not healthy for critical functions in any given industry to have dominant players with nearly 50% market share.  The criticality of both Change Healthcare and CDK Global should not have been a surprise, as both were involved in US government anti-trust objections that noted their dominant market shares.  Scale and network effects in transaction interchange and technology businesses tend to lead to these types of concentrations.  Insurance could play an important role in price-based self-regulation if business interruption policies for Systemic Dependency Risk existed, and would be a much more attractive option than regulation.

    3. Lenders and Investment Managers should think about Systemic Dependency Risk with respect to sector concentrations

    The Change Healthcare outage particularly constricted cash flows for thousands of independent physician practice groups and smaller non-profit healthcare systems and hospitals.  And had the duration of the CDK Global outage been longer, it could have caused similar cash flow problems for thousands of auto dealerships, most of which are privately-owned and range in size from just a few stores to dozens across multiple states15.   Banks specializing in lending and financing solutions for these sectors could have seen spikes in default rates16

    Other industries may have more significant share in publicly-traded companies where a Systemic Dependency Risk event could potentially impact earnings across a sector in an equity portfolio.  There’s also the risk that knock-on effects bleed out of a narrow sector like auto dealerships, and into adjacent broader sectors like auto manufacturing and auto finance. 

    From a portfolio management perspective, Systemic Dependency Risk means that “correlation” within industries may be higher for extreme downside events than when (under-) estimated over periods without such events.

    4.  Ransomware and contingent business interruption under cyber risk insurance policies

    Both the Change Healthcare and CDK Global outages had their root cause in ransomware attacks, which have become increasingly prevalent over the past decade.  Given the intersection of Systemic Dependency Risk and technology solutions, it’s fair to suppose that ransomware is likely high among the leading underlying causes of Systemic Dependency Risk.

    Cyber risk insurance policies generally cover the policyholder for business interruption if it’s caused by an attack on their systems.  Policies may also cover business interruption caused by third-party systems used by the policyholder becoming unavailable due to an attack on that third-party (sometimes worded as “Dependent Systems Failure” coverage), but typically with much lower sub-limits and/or exclusions.  

    It’s unlikely that healthcare providers inability to submit EDI transactions to the Change Healthcare clearinghouse would meet definitions for business interruption coverage under cyber risk insurance policies, though some of Change Healthcare’s other RCM solutions may have been offered as on-premises software or Software-as-a-Service resulting in partial coverage.  The CDK Global case is a bit likelier for cyber risk insurance coverage because of its more direct role as a Software-as-a-Service and sometimes also as Managed Service Provider, and indeed at least one auto dealer (Group1 Automotive) recognized an insurance recoverable.

    But in general, Systemic Dependency Risk caused by ransomware attacks will only be covered as contingent business interruption under cyber risk insurance in a subset of cases where the third-party dependency meets the definitions under the policy wording, and even then subject to sub-limits and exclusions that may limit the effectiveness of coverage.  Cyber risk insurance certainly will not help with non-technological dependencies that are interrupted by cyber attacks (e.g. the Colonial Pipeline ransomware attack and the Schreiber Foods ransomware attack, both in 2021).  And obviously ransomware is only one of many potential causes that could disrupt a critical dependency. 

    So from a Systemic Dependency Risk management perspective, you might get lucky and find you have some coverage from your cyber risk insurance policy, but counting on luck is obviously not an acceptable risk management approach.


    1. Or for old timers like me, Katrina-Rita-Wilma from 2005. ↩︎
    2. It’s a somewhat complicated corporate history:  Change Healthcare itself began in began in 2007 as a technology platform for healthcare plan cost transparency and consumer engagement.  In 2014 it was acquired by Emdeon, with the combined entity taking the Change Healthcare name.  Emdeon, formerly known as WebMD prior to spinning off its namesake consumer-facing online healthcare information business in 2005, had become a healthcare business-to-business technology juggernaut with a string of more than a dozen acquisitions beginning with Healtheon in 1998.   Then in 2016 the newly re-branded Change Healthcare merged with the Technology Solutions businesses of McKesson, one of the largest medical supplies and pharmaceuticals distributors to the US healthcare system, roughly tripling its size.  And then in 2021 Change Healthcare was acquired by UnitedHealth and merged with the healthcare technology businesses in its Optum Insight subsidiary. ↩︎
    3. Even copayments and deductibles collected from patients are determined by their healthcare plans.  True self-pay is mostly limited to cosmetic procedures and the uninsured. ↩︎
    4. Each claim requires one or more diagnosis codes and one or more procedure codes, potentially with modifier codes, in addition to the provider and facility information, patient information and healthcare plan numbers. The ICD-10 classification system contains over 69,000 diagnosis codes and over 72,000 procedure codes. ↩︎
    5. $1.2 billion in Q4 2024 to bring the net balance to $4.5 billion at year-end, and another $0.9 billion in Q1 2025. ↩︎
    6. Note that unsubmitted claims generated excess cash relative to claim cost projections for UnitedHealth and other payers, offset by an increase in reserves.  Passing that excess cash on to providers as interest-free loans is essentially equivalent to just paying the expected claims in advance of submission. ↩︎
    7. $4.5 trillion annual US healthcare spend, 40% through Change Healthcare. ↩︎
    8. CDK has its origins in the early days of computerization with a couple of companies providing accounting and inventory management systems for auto dealers that ADP acquired in 1973.  Over many years (and many acquisitions) following, the ADP Dealer Services division had evolved into a much bigger and broader Dealer Management Systems provider, before being spun off as CDK Global in 2014.  When it tried to acquire a much smaller rival called Auto/Mate in 2017, the US Federal Trade Commission’s objection noted that the resulting combination would have 47% market share. ↩︎
    9. Somewhat ironically, CDK Global in particular touted cybersecurity as a key feature of its MSP services. ↩︎
    10. For the six large publicly-traded dealership groups – AutoNation, Penske Automotive Group, Asbury Automotive Group, Sonic Automotive, Group1 Automotive and Lithia Motors – in aggregate, parts & service and financing & insurance segments respectively accounted for 42.7% and 25.5% of total gross profits in 2024, while new car sales and used car sales segments accounted for 21.5% and 10.3%. ↩︎
    11. Sonic Automotive reported core DMS restoration on June 26th, AutoNation on June 29th, and Group1 on June 30th. ↩︎
    12. Penske Automotive Group reported full restoration on July 2nd, Group1 on July 3rd, and Asbury Automotive Group on July 8th. ↩︎
    13. For example, Penske Automotive Group noted an additional impact from delay awaiting Daimler’s reconnection. ↩︎
    14. Estimated US auto dealership annual revenues of $1.1 trillion, with 40-50% affected by CDK Global. ↩︎
    15. The market is still quite fragmented:  the 150 largest dealerships still only account for around one quarter of the industry’s volume. ↩︎
    16. Hospitals and healthcare systems also represent about 7% of the municipal bond market. ↩︎

  • CrowdStrike – lessons learned from a Systemic Dependency Risk “near miss”

    One year ago tomorrow on July 19th 2024, we all woke up to Friday morning headlines about a global IT problem causing Windows-based computers to display the “blue screen of death”.  I’m sure like many other people, my immediate reaction was that this might be cyber risk’s version of the “big one” that we’ve all long feared: a global malware event that would brick all of our computers and send society back to the Stone Age.  While it was initially being called a Windows outage, it soon became clear that the culprit was a faulty software update from CrowdStrike that had somehow crashed Windows. 

    The breadth was truly global and across almost all industries.  Major airlines were grounded, health care systems went into downtime protocol, banks and payment systems1 were down… it looked bad2.  But within hours CrowdStrike issued a fix and Microsoft provided restoration instructions so that recovery began over the course of that day for most companies and mopped up over the subsequent weekend by hard-working IT teams.  And just like that it was mostly over (unless you were a passenger trying to fly on Delta Airlines), and it became a “near-miss” incident for the types of interconnected systems disruption that are worrisome for Systemic Dependency Risk.

    This is the first in a series of retrospective looks at historical Systemic Dependency Risk events and near-misses.  Because this one is a near-miss, it will focus less on impact details and more on implications and lessons learned.  The headlines on the impact are economic losses estimated at $1.7 billion to $5.4 billion, with insured losses of only $300 million to $1.5 billion3.

    Before diving into it, it’s worth noting that this incident perhaps doesn’t strictly qualify as a Systemic Dependency Risk event because the failure actually occurred on the victims’ internal machines, rather than on an external service4.  It’s splitting hairs, but CrowdStrike’s software and services weren’t unavailable; their software update service successfully sent updates, one of which unfortunately caused a Microsoft Windows failure on machines that installed the update.  Otherwise, the event bears all the hallmarks of a Systemic Dependency Risk event – particularly the breadth of impact – which can provide some very important lessons learned:

    1. Systemic Dependency Risks can come from unexpected places

    It is no small irony that the cause of the incident is software that was meant to protect its users from cyber security threats.  If you had asked senior executives and/or risk management for a typical large company to list their top 25 highest-risk dependencies, I seriously doubt that any of them would have had CrowdStrike on their list; software as a category probably wouldn’t have any representation on the list for many companies.  There are several reasons why CrowdStrike or similar might not be front of mind for dependency risks, but probably the two most important are: (1) dependency awareness tends to be operations-centric, i.e. traditional physical supply chain, key partners and critical service providers, etc., and (2) the list of dependencies can be really, really long in the modern age of complex business models and technology.  

    To the first point, CrowdStrike snuck into the dependency chain via the IT department rather than revenue-facing business units – or even more “traditional” mid-office functions like HR and Finance – where the senior management team tends to have more focus and familiarity.  When it comes to technology dependencies, the IT department is typically positioned as a gatekeeper to prevent these sorts of dependencies, or at least raise awareness and force mitigation and disaster recovery plans.  That gatekeeping function may be compromised when IT is the ”buyer”, as discussed further below.  

    It may be tedious, but it’s probably worthwhile to do routine reviews of the end-to-end comprehensive process flow for each business unit and/or distinct product line as well as all support functions in order to surface potential dependencies.  And it’s not just the vendor list.  Dependencies can arise on the sales and revenue-cycle side as well as the production side of the business, and can come from a broader range of inputs, infrastructure and background conditions than the more narrow traditional supply chain view.   

    Internal vendor management and IT approval documentation might help to ensure that the process flows are comprehensive and complete, but there’s no substitute for doing the full “I’m Just a Bill” detailed process walk-throughs with the responsible managers.

    Stuck in committee

    2. Knock-on effects can be worse than the source disruption

    Arguably, the CrowdStrike incident is one big knock-on event – the Windows failure caused by the CrowdStrike software update – as discussed above.  For most companies, the downtime on core systems was less than a day, plus some additional IT restoration time over the subsequent weekend. 

    Knock-on effects into other critical dependencies were mostly brief and not very consequential.  Some major ports experienced shut-downs overnight but were operational again by morningFedEx and UPS experienced delays on deliveries scheduled for the day of the incident.  Cancelled flights caused a jet fuel storage problem for excess supply in California. 

    But not all dangerous cascading consequences are external.  Like most other companies, Delta Airlines was able to restore its Windows-based computers relatively quickly, but the number of changes caused by cancelled and delayed flights left their crew-tracking software “unable to effectively process the unprecedented number of changes triggered by the system shutdown” resulting in even more cancellations.  Delta’s disruption spanned approximately 5 days while competitors quickly recovered over the weekend.  The airline industry was already well aware of the criticality of crew-scheduling systems following the Southwest Airlines meltdown in December 2022, and indeed maintaining high-volume dependability of this system was a key consideration in adopting a hybrid cloud-mainframe architecture that was highly touted in the renewal of its third-party systems support and modernization agreement in 2023.  Despite this, Delta’s system failed spectacularly, turning a brief IT disruption into a $500 million loss.  Obviously this suggests they probably needed more robust testing of the system – including a scenario with a cold shutdown and an initial load of a full day of cancelled flights – but more importantly, also a better plan for what to do if the system is unavailable.

    One key aspect of mitigating Systemic Dependency Risk is planning ahead for what to do in the event of a failure of a key dependency or critical downstream system – an outage “runbook”.  This is understandably a standard for industries where operational continuity has life-and-death consequences such as hospitals.  Indeed, airline pilots are trained extensively in protocols for in-flight failures including mechanical, electronics and communications systems, so you might think airlines would find this a familiar concept.  An outage runbook won’t eliminate the risk – presumably the reason the dependency exists is because it’s operationally more efficient than alternatives – but it can help everyone quickly get on the same page for how best to minimize the impact.

    3. The first rule of IT Security should be to follow all of the rules of IT Security

    Anyone who has been entangled in a months-long software procurement process at a large company knows that IT departments typically have quite stringent rules about systems access, external connections, information security, testing requirements, disaster recovery documentation, etc.   You wouldn’t dare bring the IT approvers a software vendor that wants privileged access to automatically push updates to “kernel driver” files5 on your company’s servers and laptops: you’d be laughed out of the room because of the risk of introducing a problem – either malicious or unintentional – to those computers’ operating systems.  Yet somehow, that’s what many companies’ IT Security groups signed up for with CrowdStrike. 

    While cyber security software may have a legitimate need to run at the operating system level in order that it can’t be interfered with by the malware it is trying to detect and prevent, and cyber security software updates may be urgent in the face of continually evolving threats, those updates shouldn’t circumvent safe IT practices.  In particular, software updates should be applied first in an isolated “test” environment to ensure that they work as intended with no adverse consequences.  It’s also good practice to stagger the roll-out of broad updates so that the update can be halted and corrected if any problems are experienced in the initial waves.

    But the broader issue is one of checks and balances.  Part of why IT Security has an approval function is because of the gap in relative expertise between the IT department and typical business users; otherwise those business users might unknowingly make risky decisions.  Equally important, IT Security approval ensures that awareness of the organization’s IT risks is centralized and that IT risk mitigation policies are applied consistently throughout the organization.  While it’s important that IT Security follow all of its own policies and processes for approving IT Security software, from a checks and balances perspective there may also be a need for audit and/or risk management review and reporting to ensure organizational awareness and acceptance of any risks IT Security is taking on.

    4. Contracting practices are overdue for review

    Like many software and services vendors, CrowdStrike’s standard terms and conditions includes a very strict “Limitation of Liability” clause that provides no liability whatsoever for lost revenues or profits, and in any case limits liability to the fees paid for their service6.  While there may be some uncertainty around the enforceability of such limitations7, it’s important to recognize that these terms can leave the company with no recourse for failure of a critical dependency, which will also typically not be covered by insurance.  If acceptance of these contractual limitations can effectively mean acceptance of an enterprise-level material risk, the contracting process should expand beyond legal and vendor management to include risk management review and senior management approval where appropriate.

    The market practice of strict limitation of liability for software and services vendors is a relic of an era when these types of vendors were smaller (oftentimes so small that their liability was effectively very limited by financial capacity anyway) and less likely to be critical dependencies with the potential to wreak business interruption havoc.  In our modern interconnected economy, the software and services companies that have the potential to be Systemic Dependency Risks are often some of our largest and most cash-rich companies8

    What if instead of generating risk to their customers, software and services vendors provided stronger warranties and service level agreements without unduly narrow limitations of liability?  This would align the risk of outage or disruption with the authority over product design, processes and policies for controlling that risk.  Presumably this would shift the problem of insurance cost and capacity to the vendors, but it might be better aligned to existing Errors & Omissions liability products.  And if customers adequately recognized their economic cost of risk for potential dependency disruptions, some of the vendors’ insurance costs could presumably be passed on to customers in a higher-price-for-lower-risk value proposition relative to competitors who foist the risk onto their customers.

    5. Value of diversity in commercial ecosystems

    At the time of the incident, CrowdStrike had more than 24,000 clients, including 60% of the Fortune 500.  Like many technology-driven services, there is a tendency towards concentration due to inherent operating leverage (the marginal cost to service an additional customer is low), especially in cases where the business value is amplified by network effects.  Absent any cost to discourage it, these dynamics will tend towards unhealthy concentrations.

    The CrowdStrike incident provided a particularly good example of the value of ecosystem diversity:  while the largest airlines experienced thousands of cancellations, Southwest Airlines (somewhat ironically), Alaska Airlines and JetBlue had almost none.  Indeed, SEC filings from JetBlue and Alaska Airlines even noted that the disruption provided a revenue boost from accommodating passengers whose flights on other airlines were cancelled.  Initially there were unfounded rumors that Southwest dodged the bullet because they were running on an outdated Windows 3.1 operating system, but it turns it was because out they “primarily utilize a CrowdStrike competitor for endpoint cyber security protection”. JetBlue and Alaska Airlines have also been clients of CrowdStrike competitors.

    Nobody chooses their software based on the potential opportunity for profit or schadenfreude if their competitors experience a disruption from using an alternative software product with higher market share9 .  Products might achieve high market share simply because they’re better, outweighing the protection from diversity provided by low market share products (see box below for my anecdotal experience). But from an overall economic perspective with respect to Systemic Dependency Risk, everyone would be better off if no single vendor had a concentrated share.  Following the CrowdStrike incident, there were some calls for regulatory intervention to break up “digital monoculture” in attempt to prevent or limit the severity of similar incidents in the future.  Trying to regulate market share has always been politically challenging, and even well-meaning regulations to encourage healthier competition may be easily circumvented.

    Some Love for Lotus Notes

    In 2000, the ILOVEYOU computer worm became one of the most widespread computer viruses in history to that point, infecting over 50 million computers (thought to be around 10% of those connected to the internet at the time).  It contained a Visual Basic script attachment which would send copies of itself to all contacts in the user’s address book, searched for certain file types on any connected drives to replace with copies of itself, and set the Internet Explorer homepage to a URL that downloaded a Trojan Horse.   

    Very few people at the time had any real cyber security awareness.  The previous worst incident – the Melissa virus in 1999 – only infected an estimated 1 million computers and didn’t receive widespread attention.

    I received the e-mail with subject line “ILOVEYOU” from a former colleague who was known for being pretty funny, so I opened it immediately.  Luckily nothing happened because the company I worked for at the time used the already outmoded Lotus Notes suite for e-mail, and the Visual Basic script was only able to run in Microsoft Outlook. 

    As an e-mail application, Lotus Notes had a lot of drawbacks compared to Microsoft Outlook at the time: clunky user interface, unexpected application crashes, and occasional incompatibility with other applications.  But as an inadvertent cyber security defense, it saved me – and all of my coworkers and e-mail contacts – from the ILOVEYOU virus.

    Insurance for Systemic Dependency Risk would be the best solution to encourage diversity via the “invisible hand” of pricing, both by placing a transparent cost on the risk companies are assuming, and also by adding a risk premium to the most concentrated risks to account for limited capital capacity and potential correlation to financial markets. 


    For each incident in this series of case studies, a few key characteristics and statistics will be tracked with an eye towards eventually having the tools to quantify frequency and severity of these events:

    Incident Summary
    CrowdStrike Global IT Outage – July 18, 2024

    Source of disruptionSoftware
    Root causeHuman error (programming)
    Scope of impactGeographicGlobal
    IndustriesAll (but especially airlines and healthcare)
    Estimated revenue$30 billion – $60 billion per day10
    Duration< 24 hours for restoration of core systems for most companies, with some additional time and expense for full recovery
    Estimated lossesEconomic$1.7 billion – $5.4 billion
    Insured$300 million – $1.5 billion
    Known lossesDelta Airlines: $500M

    1. Consumers reported payments problems even though Visa and Mastercard stated they were unaffected, but disruptions may have occurred with other parties in the payments processing chain. ↩︎
    2. The Wikipedia page for the incident does a very good job of cataloging many of the impacts. ↩︎
    3. Low insured losses are potentially due to a number of factors:  take-up rates on cyber risk insurance overall, take-up rate and sub-limits for systems failure coverage (i.e. business interruption) in cyber policies, the quick recovery time such that typical waiting period thresholds – the deductible for business interruption coverage – may not have been met, and significant retentions typical in cyber risk insurance programs for large companies. ↩︎
    4. And I have no idea how this was adjudicated with respect to cyber insurance policies, where the difference between a (internal) systems failure vs. and a (external) dependent systems failure could determine whether the full limit applies rather than a much lower sub-limit. ↩︎
    5. Apologies if my very superficial technology knowledge has resulted in any botched terminology here. ↩︎
    6. Some clients may have negotiated changes to the terms and conditions. For example, based on court filings in Delta Air Lines Inc. vs. CrowdStrike Inc., Delta’s contract specified a liability limit of two times fees and an exception for gross negligence or willful misconduct ↩︎
    7. Delta’s lawsuit against CrowdStrike recently survived CrowdStrike’s motion to dismiss, albeit with a significantly narrowed set of claims and some skepticism about Delta’s likelihood of success. ↩︎
    8. For example, cloud computing providers like Amazon, Microsoft and Google are three of the five largest companies in the US by market capitalization.  CrowdStrike at $117 billion as of today ranks 93rd; as of April 30th, 2025, it had $4.6 billion cash and equivalents on its balance sheet, which is a bit more than its annual revenue annualized from the most recent quarterly result of $1.1 billion. ↩︎
    9. On the other hand, it might not be a bad strategy for mitigating cyber risk: low market share vendors may be less attractive targets. ↩︎
    10. Daily equivalent of 60% of $19.9 trillion annual revenue for Fortune 500 plus a smaller proportion of small to medium-sized enterprises which have similar magnitude of revenues overall to Fortune 500. ↩︎

  • Systemic Dependency Risk: Caught in the Commercial Insurance “Protection Gap”

    When we talk about the “protection gap”, we are usually thinking about natural disasters like floods and earthquakes where losses are insurable through existing insurance products, but significantly uninsured or underinsured due to low take-up rates on expensive policies, large deductibles and/or low limits.  Big natural disasters also can cause losses falling outside of insurance coverage due to diffuse or indirect knock-on effects such as damage to public infrastructure, environmental contamination, reduction in general commercial activity during evacuation and recovery, or even longer-term job losses and population displacement or migration.  Commentary following a large natural disaster often includes an estimate of overall “economic losses” as well as a typically much smaller number for insured losses1; the (uninsured) difference between them is the protection gap. 

    One of the biggest sources of those uncovered economic losses is typically business interruption, especially indirect or contingent business interruption which might be caused by disrupted suppliers, but also broader causes like power outages, transportation problems, booking cancellations in the tourism industry, or even more broadly reduction in spending from customers who have evacuated or are preoccupied by recovery, etc.  Business interruption as a source of losses is not unique to “insurable events” like natural disasters, and I will contend that business interruption in the form of Systemic Dependency Risk has the potential to create massive economic losses while falling almost entirely outside of existing insurance product coverage – potentially the largest protection gap of all.

    The insurance industry has offered business interruption coverage for more than two centuries under traditional property insurance policies and more recently under cyber insurance policies (“systems failure” coverage)2. But it’s an awkward fit:   business interruption under a property insurance policy generally triggers only if caused by covered property damage to the policyholder’s facilities, or in the case of contingent business interruption coverage (as well as ingress/egress and civil authority order clauses), property damage to a third party asset that would have been covered had the asset belonged to the policyholder.  The September 11 terrorist attack and the COVID-19 pandemic provided great examples of business interruption claims under property insurance policies providing uncertain coverage when events fall at the margins of the scope contemplated by policy wordings3.  Uncertainty of coverage is not good for either the insurer or the insured, and can result in costly litigation.

    It’s also worth noting that contingent business interruption coverage in property insurance policies – especially after Hurricane Katrina in 2006 – is generally not common anymore and tends to be quite expensive and/or limited. 

    Similarly, business interruption under a cyber insurance policy’s systems failure coverage is limited to covered events under that policy such as ransomware, data breach, denial of service attack, etc. that cause the interruption to the policyholder’s systems, or under dependent systems failure coverage to a third-party systems provider’s services.  Cyber insurance policies do not cover contingent business interruption arising from a cyber event disrupting any other types of third-party suppliers (for example, makers of cream cheese-based products facing a shortage in 2021 due to a ransomware attack at one of the country’s largest dairy products producers)4.  Dependent systems failure coverage under cyber policies has become increasingly subject to smaller sub-limits and exclusions for third-parties that pose portfolio-wide risks, such as cloud computing providers and internet service providers.

    That said, just because business interruption is an awkward fit under traditional insurance policies doesn’t mean Systemic Dependency Risk can’t be insured.  Where demand is acute and if the risk can be understood and doesn’t violate fundamental principles of insurance, the insurance industry has a reasonable track-record of creating new products – for example, the evolution of cyber risk insurance policies over the past three decades – and there have been some attempts in the broader business interruption insurance space such as for pandemics, cloud computing outages, and trade disruption, albeit with limited capacity and/or high cost. 

    So what makes Systemic Dependency Risk so difficult for insurers?  Two very fundamental challenges:  underwriting and capacity.

    Underwriting

    For established risks with high annual claims volumes and some degree of homogeneity across insureds, underwriters can look to loss cost histories to assess both expected profitability and risk of losses in relation to premiums.  This works well for insurance lines like workers compensation, commercial auto, etc. but that’s obviously not going to work for Systemic Dependency Risk.  When faced with low probability but potentially large losses, sparse loss histories and significantly different risk profiles amongst insureds – for example, natural disaster risk in property insurance, cyber risk insurance, etc. – more complicated underwriting analysis is required.  Typically underwriters and actuaries break this up into two components:  frequency and severity, which combined can provide an expected loss cost as well as a means of modeling the risk of very large losses both for individual policy risks and across a portfolio for accumulating risks. 

    The frequency component for Systemic Dependency Risk may be somewhat daunting for underwriters given the lack of historical data.  This is particularly true when considering the full universe of dependencies to which an individual insured might be exposed, which could be quite opaque to a potential insurer no matter how thorough the application questions and submission information.  However, one could imagine underwriters wrapping their minds around the frequency component for a collection of specific dependencies, especially where there’s scalability if those dependencies are shared across multiple insureds.  A reasonable analogy would be earthquake risk, where models consider a large number of source faults and magnitudes with different occurrence rates informed by a limited history augmented by seismology.  Any given insured is exposed to some subset of those potential earthquakes, and underwriters are able to get comfortable with the modeled expected loss cost due to earthquakes as one component of the “technical premium” to inform pricing, as well as the probabilistic portfolio-wide modeled losses for earthquakes affecting many policies.

    Unfortunately, loss severity for business interruption risks is a much different animal.  For property insurance, the property damage component of loss severity is well-understood and informed by historical experience – there have been lots of fires, earthquakes, hurricanes, etc. which have happened to lots of different types of buildings with different construction characteristics.  Consequently, the business interruption component of loss severity for downtime as a result of property damage is also reasonably well-understood and informed by historical experience.   At some level, the impact of losing the production or sales volumes of a damaged facility is fairly straightforward5, though perhaps somewhat more unevenly dependent on individual insureds’ business models and their mitigation and recovery practices.   

    But business interruption for Systemic Dependency Risk is a lot more complicated.  Depending on the nature of the dependency, the scope of disruption can be one or more business units or even the entire business, rather than individual locations.   The business may be able to at least mitigate some types of disruption with inventory stockpiles, redundancies, outage runbooks, etc.  And the underlying business model matters – for example, are disrupted sales lost forever (e.g. airline seats6), or can disrupted sales be deferred and recovered when the disruption is over?

    While the complexity of potential dependency disruptions should be well understood by the company’s risk managers and other senior leaders, the challenge for an underwriter – in the absence of a long history for very similar companies experiencing such disruptions – is the enormous amount of information and analysis it would take to gain a similar understanding.  This information asymmetry between insured and insurer is a big problem if the gap is too wide:  the underwriter can’t give every applicant the benefit of the doubt or they’ll lose money, so they have to price at average or below average relative to the information available.  But if the difference between the price they quote and the “fair” price for less risky companies is too steep, those less risky companies won’t buy the policy and the pool of insureds will be differentially likely to be more risky companies (i.e. adverse selection), leading to a downward spiral of higher prices and fewer insureds where the underwriter cannot break even.

    In addition to frequency and severity, the underwriter has to set a premium to cover administrative and distribution costs, as well as an adequate return on capital… and this may be a capital-intensive risk, which brings us to the problem of capacity.

    Capacity

    It’s no secret that the insurance industry doesn’t like large accumulation risks, meaning a single event that can cause losses across many policies – often both personal and commercial lines – such as hurricanes, earthquakes and floods.  This aversion manifests in commercial insurance as exclusions, higher deductibles and sub-limits.  For example, in property insurance it’s fairly common to see “named storm” (i.e. hurricane) or “movement of earth” (i.e. earthquake) subject to higher site deductibles, as well as policy-level per occurrence deductibles, lower per occurrence limits and annual aggregate limits. In a big disaster, an insured might both retain much more loss before the insurance policy pays out and also have losses exceeding limits in the biggest events.  In cyber risk insurance, the possibility that a single point of failure such as a cloud computing or internet service provider could accumulate losses across huge swathes of policyholders has resulted in the exclusions and low sub-limits on dependent systems failure coverage discussed above.

    Why is the insurance industry so allergic to large accumulation risks?  Simple:  the industry is just not very big.   In the “classic” business model of insurance, the risk that any given policy has a loss – which might be a very risky large loss from the policyholder’s perspective – is unrelated to that of another policy, such that across a large portfolio of policies the frequency and overall severity of losses becomes fairly stable for the insurer.  In this case, the insurer holds capital above and beyond reserves to cover random variability in the overall frequency and severity of loss (often called “process risk”, or perhaps “bad luck”) as well as the risk of underpricing, parameter misestimation or the effect of underlying latent variables driving frequency or severity.  With large accumulation risks, the insurer needs to hold capital against the potential severity of one or more extreme events up to some threshold of acceptably low probability of occurrence.

    So how much capital does the insurance industry have?   This is surprisingly a little difficult to answer because of all of the different channels through which risk flows into wholesale, reinsurance and even capital markets.  Further, many insurers have particular geographic, market segment and/or product line specializations, and many reinsurers have global scope, often spanning primary, specialty and re- insurance, and sometimes both life/health insurance and property & casualty insurance, so a precise estimate of how much insurance industry capital there is might need to be constructed in relation to what type of loss you’re interested in.  But just to put some rough numbers on it for the US, the National Association of Insurance Commissioners reported an aggregate policyholder surplus of $1.138 trillion for all US property & casualty insurers as of June 30, 2024.  Lloyd’s of London adds approximately $60 billion, though much of that is in members’ funds specific to the syndicates those members support, each of which may have different geographic and product line scope.  Estimates of total global reinsurance capital for 2024 range from $515 billion to $655 billion, with as much as $115 billion of additional alternative capital.  So, let’s say that total US re/insurance industry capital is roughly $1.9 trillion, which may be a bit generous.

    $1.9 trillion sounds like a lot of capital…  until you consider the potential size of a major California earthquake or Florida hurricane may be over $300 billion at a 1-in-100 year probability threshold7, representing more than 15% of that capital.  Of course, insured losses are much less than overall economic losses (especially for California earthquakes because the fraction of households with earthquake insurance coverage is in the teens), so the industry is not actually putting that much of its capital at risk for a 1-in-100 year natural disaster.  Indeed, Aon’s 2021 Catastrophe Risk Tolerance Study showed that insurers’ disclosed 1-in-100 and 1-in-250 losses8 measured as a percentage of shareholder equity are typically in the 5% to 10% range, with a handful of extremes in the 20%-30% range for 1-in-250 losses.  Also bear in mind that well-rated insurers are expected to be able to pay losses in extreme events of at least a 1-in-250 year return period level(and as a reminder, events at that level of improbability can be quite extreme)9

    And this is exactly the loss accumulation vs. capacity problem for Systemic Dependency Risk:  it is not hard to imagine loss scenarios causing hundreds of billions in business interruption losses.  In aggregate, the Fortune 500 had $19.9 trillion in annual revenues in 2024, so an event impacting 20% of the Fortune 500 for 20 days would be about $220 billion of disrupted revenues.  Those 500 companies accounted for 49% of the revenues of approximately 21 thousand US companies with more than 500 employees in 2022, and while you might suppose that small- and medium-sized companies would be less likely to be exposed to Systemic Dependency Risk, it’s easy to imagine this segment contributing enough loss to put the total disrupted revenue well over $300 billion in such a scenario.  At that order of magnitude, some insurers might perhaps be willing to dabble in this space, but the insurance industry overall is not going to be able to provide a meaningful solution to Systemic Dependency Risk.

    Where does Systemic Dependency Risk belong?

    Of course, the insurance industry isn’t the only capacity for absorbing risk in the economy.  The US banking industry’s capital is only somewhat bigger at $2.4 trillion, with which it takes on large amounts of credit risk exposed to underlying systemic elements like real estate prices, or general economic conditions in particular industries, regions, or economy-wide… and potentially including Systemic Dependency Risk that could accumulate across a portfolio of borrowers.   Capital markets are more than an order of magnitude bigger both in terms of capital and risk exposure10.  The figure below provides a to-scale illustration of the risk-bearing capacity of insurance in relation to banking and capital markets.

    Capital markets have already stepped in to fill some of the gap left by the insurance industry’s limited appetite for accumulations of natural disaster risk, to the tune of almost $50 billion of catastrophe bonds outstanding at year-end 2024.  Cat bonds found a home in fixed income markets where relatively high interest spreads relative to the low probability risk of extreme events triggering loss of principal and lack of correlation to other asset classes made them attractive.  Systemic Dependency Risk wouldn’t have that same lack of correlation to other asset classes, but the overlap with risks already embedded in corporate bonds and equity markets11, and the risk management skills and financial instruments available to participants in those markets, suggests there may be a home for it too in capital markets.

    A capital markets-based solution for Systemic Dependency Risk would still suffer from the problem of underwriting the severity aspect, as discussed above.  This likely then suggests a parametric insurance trigger based on an observable disruption event for a specific source of dependency risk, with the insured responsible to determine how much limit is appropriate for their own specific risk profile in terms of business model and risk mitigations.  On the positive side, capital markets would be ideally suited to handle the frequency aspect of underwriting, with the market price of coverage reflecting expected failure frequency for a given dependency plus a risk premium for correlation and concentration risks. 

    While capital markets potentially offer some future hope for making Systemic Dependency Risk broadly insurable, that’s more or less science fiction for now. Until such time, companies will need to self-underwrite: identifying dependencies and estimating failure frequencies, working through dependency failure scenarios to determine potential loss severity, and then “pricing” the cost of that risk in order to prioritize which dependencies need to be addressed and to make cost-benefit decisions between potential mitigation options.


    1. For example, Hurricane Ian in 2022 caused approximately $110 billion economic losses and $60 billion insured losses.  A variety of sources track insured vs economic losses by event or annual aggregates. ↩︎
    2. There are other specialty policies that include coverage akin to business interruption such as event cancellation insurance, delayed start-up coverage under construction insurance policies, and stock throughput policies with selling price valuation and/or delay coverage. ↩︎
    3. Businesses operating in the World Trade Center or its vicinity were generally covered for business interruption in the September 11 attack due to direct physical damage or under civil authority clauses when lower Manhattan was evacuated and closed to traffic.  However, widespread disruptions caused by the FAA’s ground-stop order and the more prolonged closure of Reagan National Airport – particularly for hotels, airlines and airport services companies – were generally ruled not covered under civil authority clauses because of the indirect linkage between the property damage and the ground-stop order in fear of further attacks.  Coverage for COVID-19 business interruption – a staggering sum in aggregate, potentially well over $10 trillion – has varied based on policy wording and jurisdiction, but most US courts have ruled that the virus does not constitute physical damage to trigger business interruption coverage under property insurance. Some courts also determined that stay-at-home orders and broad business category closures don’t trigger civil authority clauses because they arose from the threat of person-to-person contagion rather than viral contamination of specific locations, and anyway wouldn’t pertain if the order doesn’t prohibit access specifically to the policyholder’s premises.  UK courts generally took a more policyholder-favorable view. ↩︎
    4. Insurers may be avoiding broader cyber contingent business interruption coverage due to potential for “risk creep” and portfolio loss accumulation. ↩︎
    5. Not to minimize the challenge of appropriately allocating business interruption values to individual facilities in insureds’ Schedule Of Values submitted to insurers, nor the modeling challenge of internal value chains across multiple facilities that can create either/all conditions for business interruption. ↩︎
    6. Even if the passenger’s flight is re-booked to a later date, that displaces a future saleable seat. Airlines have significant variable costs like jet fuel, but the majority are essentially fixed costs like the cost and financing of aircraft, employee salaries, gate slot rental, etc. which are incurred even when planes are idle. ↩︎
    7. The major catastrophe risk modeling firms’ industry loss exceedance probability curves are proprietary, but for order of magnitude and discussion see the following examples:
      * Munich Re’s 2018 commentary on the risk of a very severe California earthquake,
      * Karen Clark & Company’s 2018 analysis of the financial vulnerability of Florida’s insurance market in relation to very severe hurricanes, and
      * Verisk’s 2024 report containing multi-peril modeled loss curves (Note that Tables 1 and 2 report annual aggregate losses, so the 1-in-20, 1-in-100 and 1-in-250 values partially reflect average annual losses from smaller events across all perils, plus one or more significant events for higher risk perils. Also note that these reflect only insured losses, with subsequent analysis in Figure 4 suggesting overall economic losses – insured + uninsured – almost twice as much for North America.) ↩︎
    8. “Probable Maximum Loss” or PML, which may be the worst oxymoron in risk jargon. ↩︎
    9. Or equivalently, multiple large but less-extreme events in a single year which in aggregate reach the same improbability threshold. Also note that insurers ability to conduct ongoing business after an extreme event may also depend on their post-event financial strength ratings and regulatory capital ratios, so running too big a risk of an extreme loss relative to capital can create the further risk that raising enough replacement capital could be quite challenging. ↩︎
    10. Albeit with some overlaps, as equity markets include publicly-traded insurance and bank equity, and bank and insurance companies’ balance sheets contain significant portions of investment securities. ↩︎
    11. Business interruption from a Systemic Dependency Risk event could manifest as increased default risk for corporate bonds as well as a hit to profits and potential longer-term business model consequences for equities. Additionally, for a dependency triggered by the failure a specific company, that company’s equity and bonds could also be at risk. ↩︎

  • Unprecedented?

    “Unprecedented” feels like one of the most overused and abused words over the past 5-10 years that have seen quite a few severe wildfires and other natural disasters, a global pandemic, and more than a few political upheavals.  No two disasters are exactly alike, so the most recent big one might be strictly speaking unprecedented. But in the more reasonable sense of similarity in nature and magnitude, calling our string of recent extreme events “unprecedented” betrays a lack of historical awareness and/or imagination. 

    It’s worth remembering that COVID-19 is more scientifically termed SARS-CoV-2, which is a strain of the original SARS-CoV-1 less than 20 years prior (not to mention the intervening MERS outbreak caused by another coronavirus from a different lineage within the same beta-coronavirus genus).  And of course, we have very strong precedent for a global pandemic from the Spanish Flu just over 100 years ago. 

    The recent Los Angeles wildfires are also fairly well precedented by the 1991 Oakland Hills wildfire.  The more recent event burned a much larger area (over 57,000 acres in LA vs 1520 acres in Oakland, both including substantial uninhabited areas), had more fatalities (30 vs 25) and destroyed many more structures (over 18,000 vs 3280). Even so, it’s not too hard to extrapolate from Oakland Hills wildfire to the LA wildfires or even model to foresee the potential risk of wildfire to cause substantial damage at the “Wildland Urban Interface” in a major metropolitan area.

    We seem to be using “unprecedented” to more colloquially mean something very unexpected, something that the speaker hasn’t seen before or wasn’t expecting to see in their lifetime.  But even if we allow that some events with plenty of precedent will be called “unprecedented”, we must be careful not to allow “unprecedented” to be an excuse for being unprepared for risks that have a reasonable chance of occurring.

    As risk managers and modelers, we are trained to use history in order to inform our view of the improbable, using historical data to design and calibrate risk models and then using those models to extend probability measurements to extremes that are generally beyond a typical human lifespan (e.g. commonly used standards like 1-in-100, 1-in-250, 1-in-500 or even 1-in-1000)…  but not too extreme!  At some level of improbability, catastrophic events are so extreme that it’s not worth trying to manage to them.  These extra-extreme scenarios would tend to cause such widespread devastation that companies would get government bail-outs or at least a “free pass” in comparison to their similarly devastated peers.   In the most extreme scenarios, everyone would be dead anyway.

    Asteroid 2024 YR4 made the news earlier this year when astronomers discovered it and determined that it will pass very close to Earth in 2032.  On February 18th 2025, NASA’s Center for Near-Earth Object Studies estimated a 1-in-32 (3.1%) probability of it impacting Earth, though it has since been downgraded to no chance of striking Earth based on subsequent observations.  2024 YR4 has an estimated width of 55 meters with a range of 40 meters to 90 meters1.  For reference, the 1908 Tunguska Event which flattened about 830 square miles of Siberian forest is estimated to have been 40 meters wide, while in 2013 the Chelyabinsk meteor at approximately just 20 meters wide caused glass breakage in more than 7000 buildings over an area of around 2500 square miles. 

    So Asteroid 2024 YR4 is in the “city-killer” category, were it to hit a city (see helpful guide to right).  With this level of potential severity, and at the original higher levels of probability, it briefly rated a “3” on the 1-to-10 international Torino scale for near-earth object risk classification, which is in the yellow “meriting attention by astronomers” zone;  if it had become near-certain to hit Earth, it would have rated an “8” (the lowest of the three ratings in the red zone where significant destruction is possible or likely).

    Ironically, an asteroid impact has always been the go-to example of the scenario so extreme that risk managers and modelers don’t need to worry about it2.  That’s definitely true of asteroids bigger than the “city-killer” class, up to and including the extinction event class: no sense trying to buy insurance to cover a scenario where you and your company as well as the insurers you’d be hoping would pay the claim would be dead.  

    But should risk managers have worried about Asteroid 2024 YR4, and should they worry about other future potential “city-killer” asteroids?   Keep in mind that the earth is big – 197 million square miles of surface area – and 71% of that surface area is water.  Much of Earth’s land surface area is unhabitable mountains and deserts; estimates of the inhabited portion vary but are typically around 10-15% of the land surface area.  If an asteroid hits Earth, the most likely outcome is that it impacts over water or mostly uninhabited land, as was the case with Tunguska.  We might perhaps conservatively suppose there is a 1-in-20 chance that a “city-killer” class asteroid actually does “city-killer” scale damage, conditional on striking Earth in the first place3.  Combining that with a 1-in-32 chance of Earth impact would yield a 1-in-640 chance of catastrophic damage, right on the fringe of risk thresholds that risk managers worry about.  Perhaps you might factor that down even more to account for the chance that it hits a city but not one where your company has people and assets, but then again, even without a direct hit there would probably have been a good chance of a disruption to something in your supply chain and/or revenue cycle4.

    If another asteroid actually becomes a meaningful threat to hit Earth, will people say it was “unprecedented”?  …probably, but they shouldn’t.

    So why does this matter for Systemic Dependency Risk?  Most of the systemic dependency risk events we should be worrying about will also be “unprecedented” given that we haven’t yet seen one with the combination of widespread impact and severity on a par with natural disasters and pandemics.  From a technology and business models perspective, we are still in the early days of Systemic Dependency Risk, and we shouldn’t expect there to be a robust historical record from which to draw statistics.  But we’ve seen enough early warning signs that, with a little imagination, we shouldn’t have to find ourselves completely taken by surprise when “the big one” happens. 

    Taking earthquakes as an analogy, suppose as a thought experiment that the Earth had not been seismically active until about 30 years ago…   an event like the 1906 San Francisco earthquake might be “unprecedented” relative to the 1995-2025 historical record, but you would like to think that with the record of smaller earthquakes over that period and geological analysis, seismologists would have enough talent and imagination to suppose that a magnitude 7+ Bay Area quake could plausibly happen with a sufficient likelihood to merit attention from risk managers.

    Many of the hazards we model don’t even have reliable historical observation periods nearly as long as the return periods we care about.  North Atlantic hurricanes in the US southeast weren’t recorded prior to denser settlement in the late 1800s and even then, it wasn’t until the advent of radar, satellite imagery and hurricane hunter aircraft all within the past 100 years that we were able to gain robust data for hurricanes prior to landfall.  NOAA’s hail records go back less than 100 years, and even then they are subject to severe observation bias in sparsely populated areas prior to the past two or three decades.  And while paleo-seismology offers some indications of earthquake history stretching back thousands of years, prior to the invention and deployment of seismographs over the past 100 years, older historical earthquake magnitudes have to be estimated based on severity and extent of impacts. 

    It’s always an uphill battle to convince people to worry about risks that lie beyond the frame of reference of their personal experience, even when we’re talking about probability thresholds like 1-in-100, 1-in-250, 1-in-500, etc. that explicitly do lie beyond the experience of a typical human lifespan.  Often when risk modelers talk about the extreme scenarios that make up the tail just beyond those risk thresholds, we are met with a reaction something like “that’s too extreme – nothing like that has ever happened before”.  To that I always say: 

    500 years is a very long time

    When someone says the 1-in-100, 1-in-250, 1-in-500 scenarios are too extreme (or “unprecedented”?), I offer up the following partial list of truly extreme events that have happened in the past 500 years:

    • Two severe global pandemics approximately 100 years apart:  the 1918 Spanish Flu and COVID-19
    • The 1908 Tunguska asteroid impact
    • The 1700 Cascadia Earthquake (estimated magnitude 8.7-9.2) for which there is no contemporaneous historical written record, other than The Orphan Tsunami of 1700 which was recorded in Japan without a corresponding earthquake
    • The Great Lisbon Quake of 1755 (estimated magnitude 8.5-9.0), which triggered a firestorm in Lisbon from knocked over candles lit for All Saints Day, as well as a tsunami possibly 5m high in Lisbon and over 10m high along the coast of Portugal, and also recorded in England (3m high), France, Newfoundland, the Caribbean, and Brazil
    • “The Year Without Summer” in 1815 was a volcanic winter caused by the eruption of Mt. Tambora, with major global impacts including a disrupted monsoon season and major floods in Asia, crop failures in England which contributed to the “Bread or Blood” riots and similar in Continental Europe, crop failures in the US Northeast that may have driven westward migration…  and a similar event happened just 32 years earlier when the 1783 Laki eruption caused a poisonous sulfur dioxide cloud to blanket Western Europe, followed globally by a cool summer and a severe winter
    • The Carrington Event in 1859 which is the strongest geomagnetic storm ever recorded, causing electric shocks and fires from induced current in telegraph lines and railroad tracks

    The past 500 years have also seen plenty of bizarre but less catastrophic events such as 1858’s Great Stink in London (rather amusing, in contrast to the very deadly Great Smog of London in 1952) and the Great Kentucky Meat Shower of 1876 which stands out from the surprisingly much more common occurrence of storms raining tadpoles, fish or other animals). The box at right lists 9 instances of alcoholic and/or edible floods over the past two centuries, which are amusing but for several of them causing fatalities.

    Alcoholic and/or Edible Floods

    * fatalities involved; see data table for more details

    There have also been at least two notable “unprecedented” strings of major catastrophe events over short periods of time in just the last 35 years.

    From 1991 to 1995 we had major landmark events for almost every kind of natural disaster you can think of:  

    In 2004 and 2005 we had seven major US landfalling hurricanes:

    • Charley (Cat 4)
    • Frances (peaked at Cat 4… Cat 2 at US landfall)
    • Ivan (peaked at Cat 5… Cat 3 at first US landfall)
    • Jeanne (Cat 3)
    • Katrina6 (peaked at Cat 5… Cat 3 at New Orleans landfall)
    • Rita (peaked at Cat 5… Cat 3 at TX/LA landfall)
    • Wilma (peaked at Cat 5… Cat 3 at US landfall)

    And in the winter between those two hurricane seasons, we had the 2004 Indian Ocean Tsunami caused by a Mw 9.2 earthquake off the coast of Indonesia.

    …so, when it comes to envisioning the possibility of extreme Systemic Dependency Risk events, I’ll remind everyone that we’ve had at most only a couple of decades historical experience in anything resembling our current globalized economic system and business models, and 500 years is a very long time.  We need to extend that sparse history with some imagination so that we don’t find ourselves unprepared and calling the first big Systemic Dependency Risk event “unprecedented”.


    1. That 2.25x range matters a lot when you think about the implications for mass and potential energy – closer to a 10x difference. ↩︎
    2. If you need a new extremely low probability / high severity scenario, apparently there is a 0.2% chance over the next 5 billion years that a passing star could cause Mercury to collide with Earth or eject it out of orbit. ↩︎
    3. Bearing in mind that impacts near enough to a major inhabited area, including ocean impacts causing a significant tsunami, could still be devastating. ↩︎
    4. One other unusual feature of asteroid impacts in comparison to other natural disasters is lead time. After initial observations, the probability of striking Earth is eventually revised to 0% or 100% long before impact (e.g. Asteroid 2024 YR4‘s impact would have been 2032), eventually including a fairly precise estimate of the impact location.  There will be plenty of opportunity to mitigate some of the risk (perhaps including government attempts to “nudge” the trajectory), even if assets in the impact zone have to be written off. ↩︎
    5. Both of which may have been indirectly influenced by the Mt. Pinatubo eruption. ↩︎
    6. I will allow that the flooding in New Orleans caused by Katrina, and the subsequent population displacement and regional economic impact, do properly qualify as unprecedented. ↩︎
  • What is Systemic Dependency Risk?

    A company’s dependency risk is the possibility that some asset or service outside of its control ceases to function properly, causing a disruption to its ability to conduct business, including manufacturing goods, operating services, selling its products or services, or any other activity without which the company faces adverse financial consequences.   Dependency risk obviously includes suppliers, but also may include public infrastructure, logistics, communications, third party software-as-a-service, cloud computing, outsourcing, payment systems, etc. You might think of this as a very broad or expanded version of supply chain risk, or more strictly you might think of supply chain risk as an important subset of dependency risk. 

    This more expansive version of supply chain risk is an important shift of thinking that reflects our modern economy with business models that have trended towards services rather than manufacturing, are increasingly vertically disintegrated and part of networked ecosystems, and in any case are more dependent on technology solutions in almost every aspect of the business.   Making matters more challenging, the straightforward approach to identifying supply chain risk through payables and vendor management won’t necessarily catch these modern versions of dependency risk that might be based on revenue shares or mutual benefit in an ecosystem model.

    Following are a few examples of dependency risk that fall outside of traditional supply chain risk:

    • port and/or shipping route disruption (e.g. congestion at Port of Long Beach, Port of Baltimore closure due to the collapse of the Francis Scott Key bridge, the Ever Given running aground and blocking the Suez Canal, Maersk’s NotPetya infection causing closures at ports it operated)
    • unavailability of key Software-as-a-Service (e.g. ransomware attack on CDK Global which many auto dealers rely on for sales management and/or service scheduling)
    • disruption of GPS signal for rideshare apps, automated farm machinery and transportation systems
    • unavailability of online marketplaces (e.g. eBay, amazon.com, etc.) for smaller retailers

    The variety of dependencies beyond the traditional supply chain are illustrated for a generic business in the diagram below. The top half depicts the inputs required to generate the products and/or services this business provides. Note that many of the dependencies have their own dependencies, such as logistics transporting raw materials and components throughout the supply chain. And critically, all of the inputs need to arrive at the business, which is dependent on either physical or internet access. Similarly, the bottom half follows the revenue cycle by which customers need to have the means to buy the products or services and for the business to then obtain payment.

    Any given business will face its own specific configuration of dependencies which may be a subset of the categories in the diagram, as well as other dependencies not included for this generic business. Once specific dependencies are fully identified, it’s probably more helpful to think of individual dependencies rather than categories in chains forming more of a web-like diagram.


    So why then do we care about *systemic* dependency risk?  Systemic Dependency Risk is simply the case where many companies have the same dependency such that a failure could have widespread economic ramifications and knock-on effects.  It then becomes an important risk from a public policy perspective and a potential vector for “correlation” in loan and/or equity portfolios.  In a worst-case scenario, a Systemic Dependency Risk event could potentially cascade unpredictably and chaotically into secondary Systemic Dependency Risks.

    Non-systemic dependency risks – where only one or a few companies are at risk to a failure of the dependency – are more readily controlled or mitigated.   For suppliers and technology providers, a company might consider an array of tools:  contracting provisions, lining up contingent or redundant providers, or even vertical integration.  Private-public partnerships could also be a tool in the case of infrastructure dependencies, for example if a company’s operations are uniquely dependent on a particular road, bridge or airport such that it might make sense to fund resilience improvements to mitigate the risk. 

    The other reason we care about Systemic Dependency Risks is that they are often too hot to handle for the insurance industry, similar to large natural disasters like hurricanes and earthquakes in heavily exposed regions like Florida and California.  Lack of insurance options is a risk management problem both for individual companies and the economy as a whole, as well as a loss of valuable “cost of risk” signals for decision-making.  We’ll dive deeper on the insurability angle in a future post.

    One subtle aspect of Systemic Dependency Risk is that it’s neither a peril-oriented or insurance product-oriented view of risk – we care about the unavailability of some critical service, asset, input, etc. and don’t care particularly much about what caused that unavailability.  The Systemic Dependency Risk examples we’ve discussed are all consequences of an underlying peril (e.g. ransomware for the Colonial Pipeline disruption as well as the NotPetya-Maersk port closures, potentially a geomagnetic storm for GPS signal disruption, etc.) which is an important distinction when we think about insurance solutions.  Peril-oriented modeling starts with the characteristics (location, magnitude, etc.) and corresponding frequency of some exogenous event, like an earthquake or hurricane.  From there, the event is mapped into a local hazard intensity (e.g. maximum wind speed at a particular location in a hurricane) of an exposure of interest, and then via damageability functions relating hazard intensity to the financial impact for that exposure.  Of course, from a would-be-insurer perspective, it is important to consider the underlying perils that might cause a disruption event, and particularly how that might aggregate with other exposures to that peril (e.g. infrastructure disruption caused by an earthquake that also causes large losses under traditional property damage insurance).

    Similarly, insurance products are organized around categories of loss (e.g. property damage, third-party liability, etc.).  Consequently, the underlying perils that drive those losses are generally aligned to the products (e.g. natural disasters generally cause property damage), though there are some cases of potential cross-over such as workers comp losses in an earthquake.  Business interruption is typically a secondary coverage for some policy types (e.g. property, cyber), which then also carries through the linkage to underlying perils. 

    But from a policyholder perspective, it doesn’t really matter (all else equal in terms of duration and severity of the disruption) what product category a dependency risk that has caused a disruption belongs to, and it is challenging to manage that risk with a partial patchwork or peril/product-oriented coverages across multiple polices.

    And it’s largely because it doesn’t fit the peril-based modeling and product/coverage-based insurance frameworks that Systemic Dependency Risk requires us to think about new tools and approaches to modeling and managing this risk.

  • Introducing The Risk 3.0 Blog

    Systemic Dependency Risk breaks the risk management and insurance framework – we need a “Risk 3.0”

    Risk management and insurance are facing a frog-in-boiling-water crisis of declining relevance.  We simply do not have the tools to deal with the big, existential risks of disruption – both at an individual company scale and at an economy-wide scale – that seem to be increasingly prevalent as a result of changes in business models, globalization and technology that create complex and systemic dependency patterns.  As one insurance industry executive has somewhat flippantly put it: “The problem with our business is that buildings don’t burn down any more.”

    “Black swans” like the 2008-09 financial crisis and COVID in 2020 are so big that they almost get a pass for breaking the risk management framework.  If an event is deemed sufficiently improbable with sufficiently widespread severity, there may be some safety in numbers for a company that suffers badly but in line with its peers.  For example, the major US airlines are mostly not considered irresponsible for needing a $54 billion bailout to make it through COVID without massive layoffs and/or bankruptcies.  

    But we’ve also had a recent string of concerning “near miss” business disruption events, including some high-severity regional or sector-specific incidents like the Suez Canal blockage by the Ever Given running aground in March 2021, the run on Silicon Valley Bank and ensuing regional bank crisis in March 2023,the Change Healthcare ransomware attack in February 2024, and the Francis Scott Key Bridge collapse and Port of Baltimore closure in May 2024.

    We’ve also seen broader, but fortunately less severe incidents like
    the Colonial Pipeline ransomware attack in May 2021,
    The Clearing House processing error in November 2023,
    and the Crowdstrike incident in July 2024 that illustrate the potential for widespread impact and contagion while falling short of “existential” threat magnitudes.

    To be sure, crises such as these spawn plenty of recriminations, government interventions to mitigate the damage, and reactionary new rules (e.g. Dodd-Frank from the 2008-10 financial crisis) that try to limit future exposure to a recurrence of the immediate past crisis.  But these responses tend to narrowly target the perceived causes of the preceding crisis and thus fail to generalize to the broader issue:  risks are transmitting across companies, sectors, regions and economies along lines of dependence.  This risk goes beyond some fuzzy sense of correlation, and it is increasingly inadequate to classify them as exotic “tail” risks; if black swans become commonplace, they’re not really “black swans” anymore.

    So why call it “Risk 3.0”?

    My professional career began in the early 1990s at the cusp of a quiet revolution in risk management.  The old tried and true ways – still widespread today and not at all invalid – were about risk minimization:  identify, assess, mitigate, transfer, monitor, etc.  The “Risk 2.0” revolution (we never called it that, so far as I know) was about risk quantification:  determining the potential severity and probability of bad outcomes.  But it wasn’t about quantification for the sake of quantification, or as a more sophisticated version of the “assess” and “monitor” components of “Risk 1.0”; it was about turning risk into an economic cost in order to make better decisions. 

    The risk quantification revolution naturally began in financial services, where risk-taking is inherently part of the core business.  Limits, underwriting criteria, policies, etc. (old school Risk 1.0 approaches) that limited the risk would still be part of the solution going forward, but with a stronger emphasis on maximizing the profit vs. risk tradeoff.   We developed concepts like Risk Adjusted Return on Capital (RAROC – and yes, RORAC makes more sense as the acronym if you feel strongly about it) and Net Income After Capital Charge (NIACC) that incentivized taking more risk if the expected profitability justified it, while avoiding even small risks if the expected profitability wasn’t sufficient.  Trading desks’ risk were quantified in terms of Value-at-Risk (VaR) which was in turn linked to capital.  Loan portfolio profitability was measured with a deduction for Expected Loss rather than more erratic Net Charge Offs, and capitalized in relation to a quantified Unexpected Loss volatility metric.  The most sophisticated banks began to drive this discipline down to the individual loan level, and it went hand-in-hand with some of the earliest data science applications to score individual borrowers (e.g. FICO) in relation to their expected Probability of Default. 

    Risk 2.0 was at its best in situations in diversified portfolios comprised of baskets of individual risks where the relationship between those risks could be described in terms of statistical correlation, or perhaps a conditional dependence on common systematic factors.  These approaches were capable of measuring the systemic risk in a portfolio as well as dealing with idiosyncratic risks as a result of potential “lumpiness” in that portfolio.  Sophisticated catastrophe risk models were developed to address the case of complex geospatial “correlation” of risks affected by earthquakes, hurricanes and other disasters, weaving together natural sciences, engineering, financial and probabilistic model components.

    The Risk 2.0 revolution reached its pinnacle in financial services when regulators adopted many of the risk quantification advances into the 2004 Basel II framework for internal models-based capital requirements.  In theory this was a brilliant exercise in “invisible hand” economics wherein the financial services sector would optimize the allocation of risk-bearing capacity across the economy, including the aggregate risk to government backstops (e.g. FDIC), on the basis of each individual entity compiling a portfolio of risk-efficient decisions at the individual borrower and/or transaction level.  In practice, this great experiment would swiftly be undone by rules based on lessons learned from the 2008-09 financial crisis and superseded by the Basel III framework published in 2010 (as well as Basel 3.1 in 2017 and various other additional modules). 

    Over the last decade or so, the risk quantification revolution has crept into the non-financial sector’s insurance buying behavior.  Partly driven by the need for increasingly bigger companies to expand their insurance limits, and partly driven by the desire to offset the cost of increasing insurance rates, many companies began to take a harder look at the cost/benefit economics of “working layer” insurance (i.e. the range of losses where the likelihood of claims is not that low) and increased their deductibles and retentions into layers where the expected net cost (premium minus expected claims) was high.  The most sophisticated companies model an enterprise-wide risk profile and optimize their insurance program across lines of coverage to maximize their overall risk reduction for a given net spend on insurance. 

    So while “Risk 2.0” has mostly been a tremendous success story over the past three decades, it all falls apart in the face of systemic dependency risks.  They’re not modeled well with statistical approaches relying on some sense of correlation, we don’t have a structural topographic understanding of how these risks arise and transmit (in cat modeling terms, we are lacking both the natural sciences models and the map on which to apply them), and insurance companies don’t have the capacity to offer solutions.  These challenges will require a new set of approaches and tools – Risk 3.0 – in order for risk management to regain relevance. 


    The next post on this blog will take a deeper dive into defining Systemic Dependency Risk. After that, future posts will explore other aspects of Systemic Dependency Risk and how to deal with it, such as:

    • how the economic environment has changed to give rise to Systemic Dependency Risk
    • why Systemic Dependency Risk slips through the commercial insurance “protection gap”
    • why does insurance matter – why Systemic Dependency Risk needs to be insured
    • what should risk managers do if they have Systemic Dependency Risks (or if they are one)
    • how to fix our regulatory approaches for a future with more Systemic Dependency Risk

    There may be tangential topics from time to time, particularly foundational building blocks for how to think about “tail” risks.

    Along the way, we’ll take occasional looks back at case studies and lessons learned from past Systemic Dependency Risk incidents and comment on new ones as they arise. We’ll also flesh out some potential future Systemic Dependency Risk scenarios so that hopefully we can prepare without needing future lessons learned.

    Feel free to nominate additional topics in the comments section, and of course feedback is always welcome.